Zipkin is an open-source distributed tracing backend that collects and displays spans from instrumented services. It groups spans by trace ID so developers can inspect request timing, errors, delays, and service-to-service flow. section 12.1.2 section 12.1.1
Use Zipkin when logs leave gaps across service boundaries:
- Search and explore complete request traces across distributed services. section 12.1.2
- Compare span durations to locate slow calls, database work, or services contributing to latency. section 12.1.2
- Inspect failures and asynchronous paths when a request crosses HTTP, gRPC, or message queues. section 12.1.1
Following a missing order
A checkout request calls an order service, which publishes an event to Kafka, while fulfillment stores details in a database. A trace timeline can reveal whether the delay or failure occurs in the REST call, database work, Kafka publication, or downstream processing. A deserialization warning such as an unknown enum value can explain why fulfillment never processes the order. section 12.1.1 section 12.1.2
Figure 12.3 OpenTelemetry collects relevant data from the running service. Jaeger and Zipkin are tools that aggregate and display nicely this data to help you easily troubleshoot the system.
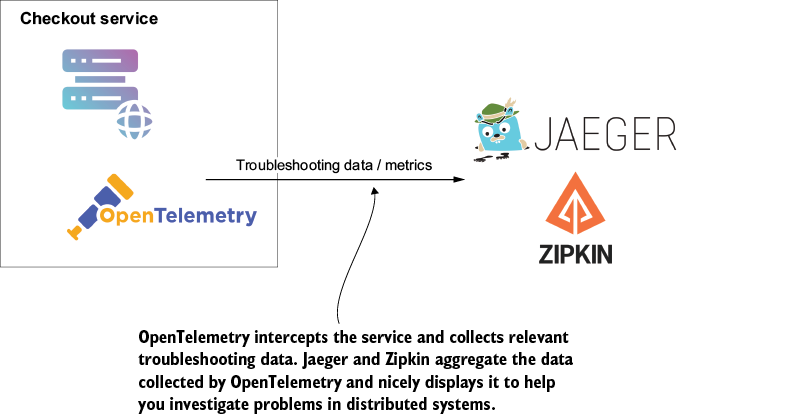
Use the architecture diagram to connect service instrumentation, OpenTelemetry collection, and Zipkin visualization. section 12.1.2
