A geometric primitive, also called a graphical primitive, is a simple shape used as a building block for graphics. Points, lines, circles, and rectangles can be combined into richer visual displays. section 1.2.2
In SVG, primitives become visible elements positioned in a coordinate system. A line uses two endpoints; rectangles use position and dimensions; circles and ellipses use a center and radii. Fill, stroke, and stroke width control their appearance. section 1.2.2
Think in primitives to break a visualization into manageable parts:
- Tree layouts can be understood as circles connected by lines. section 1.2.2
- Interactive timelines can be treated as collections of rectangles and points. section 1.2.2
- Geographic graphics can be reduced to polygons, points, and lines. section 1.2.2
Build an SVG shape gallery
Place a line, several rectangles, a circle, an ellipse, and a path inside an SVG container. Give each shape coordinates and styling, then add text labels to make the role of each primitive clear. section 1.2.2
Figure 1.8 Gallery of fundamental SVG shapes that we’ll build in this section
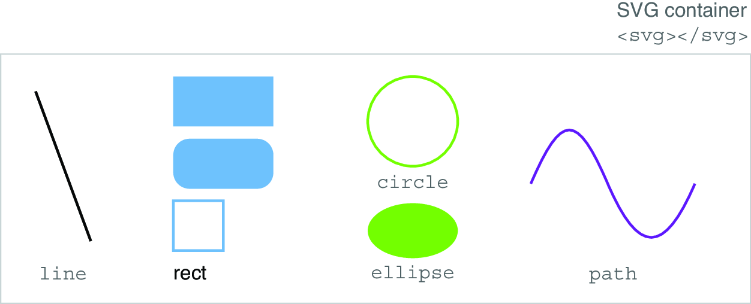
A gallery makes the distinct forms of fundamental SVG primitives easy to compare at a glance. section 1.2.2
