An A/A test assigns two randomly sampled groups no real difference, then applies the chosen test statistic to check whether the experiment behaves as expected. Repeated simulations should produce uniformly distributed p-values; at α = 0.05, about 5% should reject the null hypothesis. That observed proportion estimates the type I error rate. section 12.2.1 section 12.2.5
Use an A/A test as a pre-launch validation step:
- Define the hypothesis, expected effect, splitting strategy, statistical criteria, and required sample size. section 12.2.1
- Draw two groups from historical or simulated samples with no incurred difference. section 12.2.5
- Repeat the sampling and analysis 1,000 to 10,000 times, then inspect p-values and rejection frequency. section 12.2.5
- Compare the measured type I error with its predefined level before launching the real A/B test. section 12.2.1 section 12.2.5
PhotoStock Inc.
Before testing a new search engine, generate repeated samples from binomial distributions using the required CTR and conversion-rate values. Run simulated A/A and A/B tests to verify that calculated error rates meet their targets, while allowing the planned week of data collection to cover weekly seasonality. section 12.4.2
Figure 12.8 Simulation provides a final validation that everything is correct and set up to run an A/B test.
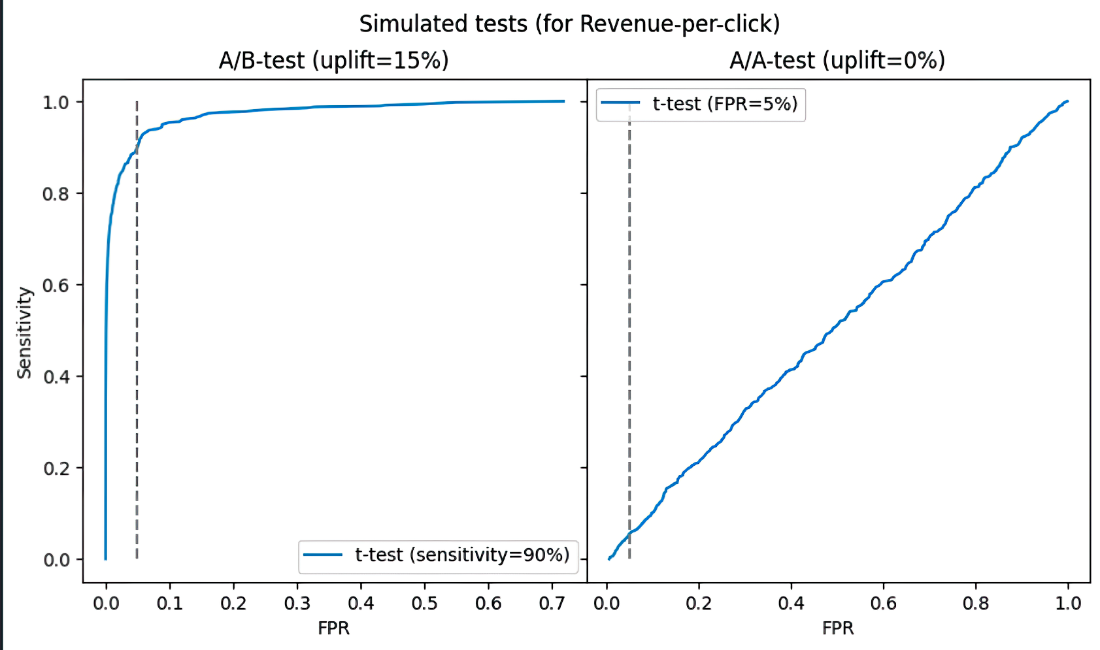
Figure 12.8 provides a visual final validation of the simulation setup before an A/B test. section 12.2.5
