Which recommendation system should a platform use? An A/B test compares alternatives by randomly assigning users to groups, exposing each group to a different version, and measuring their outcomes. The current system usually serves as the baseline against which a new model is compared. section 4.4 section 4.8
Random assignment matters because groups selected by characteristics related to the outcome can produce a misleading comparison. The aim is to make the groups substantially alike apart from the version they receive, much as in a randomized controlled trial of a drug and a placebo. section 4.4
A platform can first compare a candidate model with the current one using historical performance. A candidate that matches or exceeds it can then be tested on live traffic. Predetermined metrics, often engagement and retention, guide the comparison and the decision about wider deployment. section 4.4 section 4.8
Figure 4.5 A dashboard comparing three models during an A/B test. Model A is considered the baseline (usually, the system that is currently being used). A few measurable metrics are selected, and the performance of models B and C is reported in comparison to model A. The choice of model depends on what the metrics represent: If it’s desirable for them to increase (for example, if they are tracking the number of users or the amount of time spent), then model B is better. On the other hand, if they are tracking some negative interactions—such as abuse on the platform—model C is preferable because it decreases those.
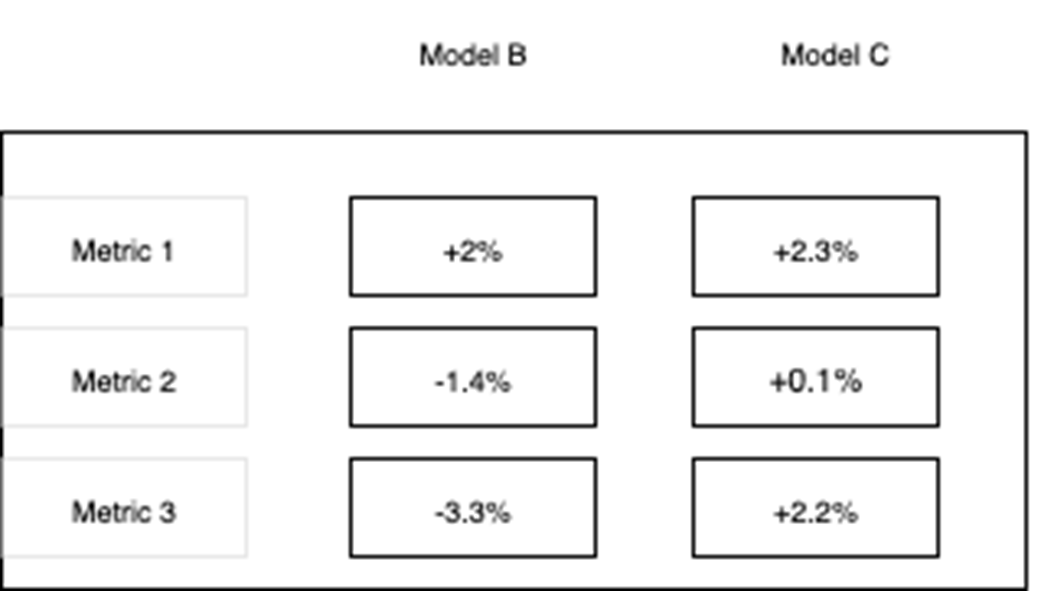
The dashboard illustrates why a winning model depends on the metric: more time spent and less abuse point toward different choices. section 4.4
Testing social contagion
Researchers reduced the prominence of positive or negative posts in users’ feeds and compared the sentiment of users’ subsequent posts. Users shown fewer negative posts were less likely to post negative sentiment relative to their baseline; a similar pattern held for positive posts. The test reshuffled candidate posts rather than inserting new ones. section 7.1
Historical interactions alone cannot reveal how users would have responded to content they never saw. A live comparison helps measure alternatives, but its result still depends on what the chosen metrics count as improvement. section 4.4 section 4.4