liveBook · Manning

Tidy table

As explained in Everyday Data Visualization

A tidy table is a tabular data structure with one row per observation and each variable stored in its own column.

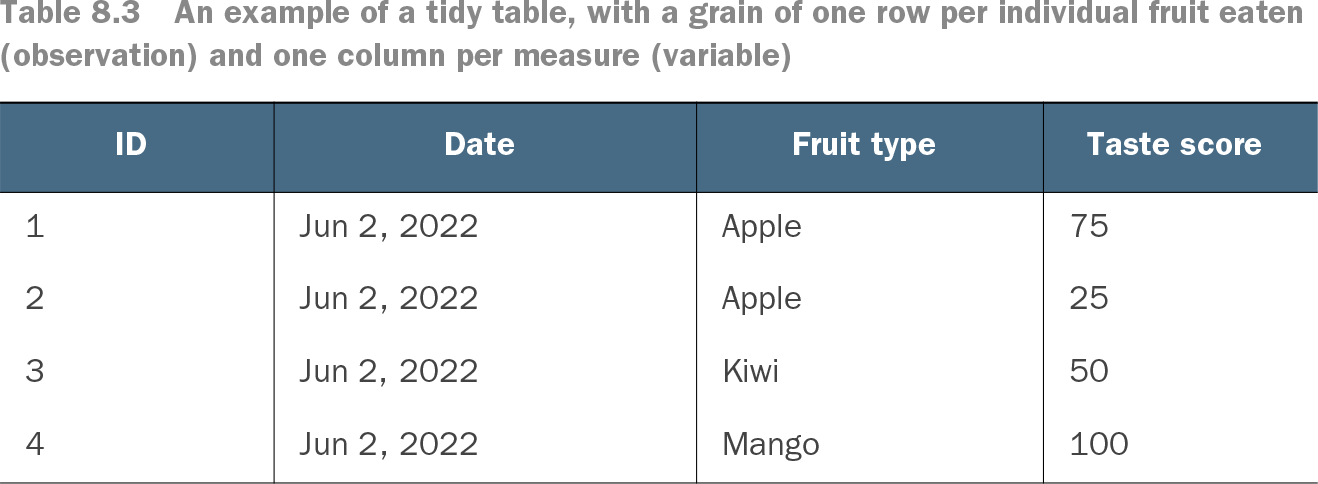
A tidy table gives every observation its own row and every variable its own column. For a fruit-tasting dataset, each row can represent one piece of fruit, with columns for ID, date, fruit type, and taste score. section 8.3.1

Use a tidy table when shaping data for visual analysis:

  • Keep data less aggregated when possible: you can summarize detailed rows later, but aggregation cannot recover discarded information. section 8.3.1
  • Connect a wide tidy table directly to Tableau or Power BI when flexible aggregation suits the design. section 8.3.1
  • Use tidy-table libraries such as Pandas for Python, or comparable tools in R and d3; otherwise, aggregate first when the code requires it. section 8.3.1
Table 8.3 An example of a tidy table, with a grain of one row per individual fruit eaten (observation) and one column per measure (variable) (view table figure)

ID

Date

Fruit type

Taste score

1

Jun 2, 2022

Apple

75

2

Jun 2, 2022

Apple

25

3

Jun 2, 2022

Kiwi

50

4

Jun 2, 2022

Mango

100

Inspect a compact tidy-table example showing one observation per row and one measure per column. section 8.3.1

How Everyday Data Visualization covers it

How deep it goes
Defines row and column structure, compares aggregation choices, and stops short of detailed library instructions.
Examples
Uses fruit observations, hotel reservations, aggregate fruit summaries, and tall daily measure tables.
What it assumes
Assumes basic familiarity with tables, rows, columns, and data structures while defining tidy organization directly.
What you can do after
Apply it via Tableau, Power BI, Pandas, R, or d3 to prepare data for flexible visual analysis.
How it connects
Connects data models, data structures, aggregation, data frames, and data visualization tools.

Related concepts

This explainer was generated by Manning's knowledge graph from the text of Everyday Data Visualization. The section links point to the parts of the book it draws on.