ABC XYZ analysis is a two-dimensional inventory segmentation method for deciding which products deserve review. It combines product importance with forecastability, assigning items to nine categories. The practical question is: where can planning attention improve the baseline forecast most? section 13.0 section 13.1.2 section 13.2
Build the matrix around metrics that support the decision:
- Use value-weighted future forecasts for the ABC axis, capturing forward-looking importance through expected revenues or costs. section 13.4 section 17.0
- Use historical forecast errors for the XYZ axis, capturing forecastability rather than merely measuring demand variation. section 13.2 section 13.4
- Review low-forecastability, high-importance products first; leave high-forecastability, low-importance products to the forecasting engine when appropriate. section 13.2
- Treat the matrix as a focusing aid, not a complete representation of supply-chain complexity. section 13.2.3
A simple segmentation
Classifying products by total volume and profit creates categories ranging from high-volume, high-profit items to low-volume, low-profit items. For forecast review, replace those illustrative axes with expected value and historical forecast error so attention targets products that matter and remain difficult to predict. section 13.1.2 section 13.4
Figure 13.2 ABC XYZ matrix with products’ importance and forecastability
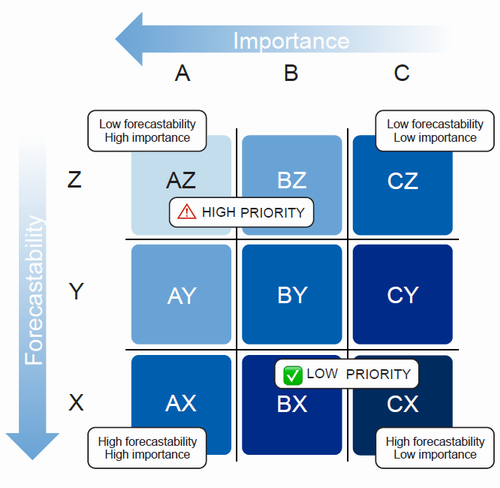
Inspect the matrix showing how product importance and forecastability determine review priority. section 13.2
