Alertmanager is the notification-handling component of a Prometheus monitoring stack. Prometheus evaluates alerting rules against metrics, then sends firing alerts to Alertmanager for routing and delivery. section 11.1 section 11.1.4
Alertmanager uses each alert’s information to decide how a notification should be delivered:
- Labels provide key-value data for routing and filtering alerts, such as severity or instance. section 11.1.4
- Annotations provide notification details such as a summary and description. section 11.1.4
- Notification providers can receive different alert priorities: PagerDuty for paging and chat systems for lower-priority messages. section 11.1.4
- The web interface at http://localhost:9093 lists firing alerts and displays their labels and annotations together. section 11.1.4
Detecting a dead node
A Prometheus rule marks an alerting condition when up{job="scylla"} == 0 remains true for 30 seconds. The alert carries severity: "error", plus a summary and description containing the affected instance. Prometheus sends the resulting alert to Alertmanager, which formats and forwards the notification. section 11.1.4
Figure 11.5 Prometheus is responsible for determining what alerts, whereas the Alertmanager is responsible for forwarding alert notifications.
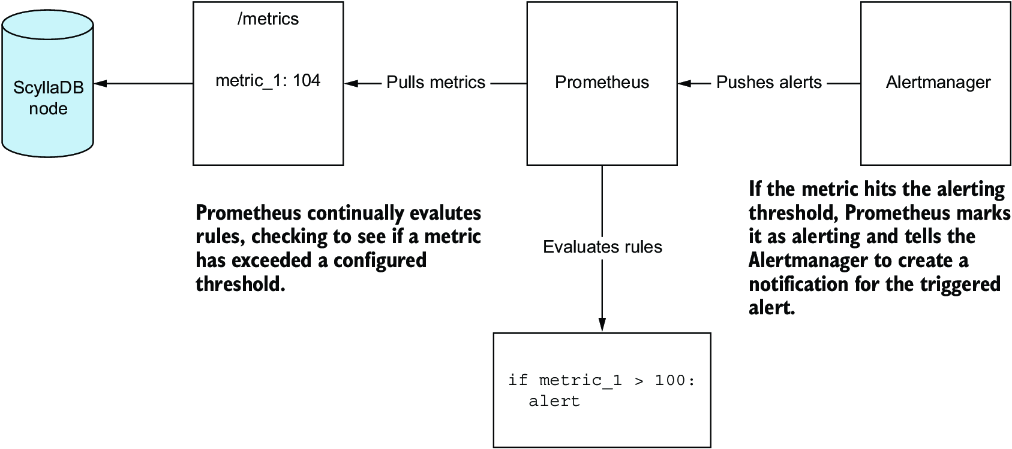
Use the flow diagram to distinguish responsibilities: Prometheus determines which alerts fire, while Alertmanager forwards their notifications. section 11.1.4
A Docker Compose configuration can launch Alertmanager beside Prometheus and Grafana on the monitoring network. The components are preconnected so metrics, alert evaluation, dashboards, and notifications work as one operational flow. section 11.1.1 section 11.1


