Analysis of variance (ANOVA) is a parametric test used to identify differences between group means. A t-test compares two groups; ANOVA can compare multiple groups and can include multiple factors. The practical question is whether outcomes differ across the conditions being evaluated. section 4.2.1
ANOVA depends on assumptions about the data within and between groups. Before relying on its result, inspect the distributions, consider whether their shape fits the assumed distribution, and check for unequal variances and extreme outliers. A significant result should not be treated as a complete account of practical importance: sample size can change whether a difference crosses a significance threshold. section 4.2.1
Comparing three app versions
A product team wants to know whether customers complete a workflow faster on one of three app versions. A between-subjects, one-way ANOVA is considered for the A/B/C test, but each group's completion-time distribution is bimodal. Square and square-root transformations do not bring the distributions closer to normality. Using the ANOVA anyway could produce unreliable recommendations for the team. section 5.1
Figure 5.1 Each distribution is bimodal, which traditional measures of central tendency can’t detect.
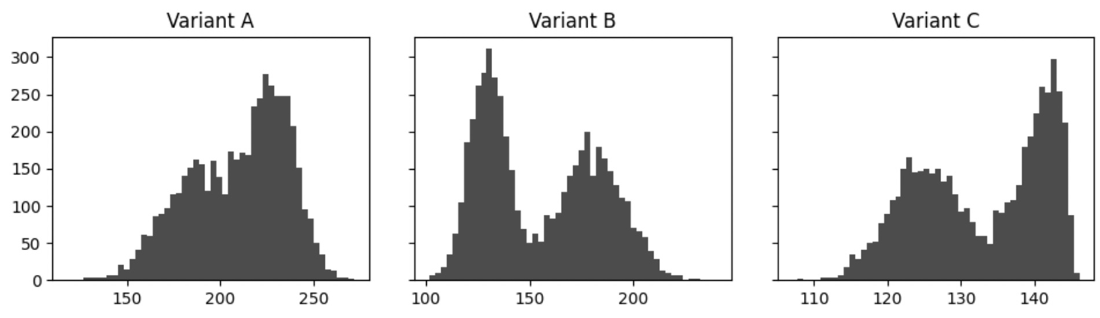
The bimodal distributions show why comparing group averages alone may miss a shape that matters when choosing a test. section 5.1
If the assumptions cannot be met, reconsider the test rather than forcing an ANOVA. One practice exercise uses histograms and attempted transformations to assess three non-normal groups, then applies a Kruskal–Wallis test and investigates post hoc comparisons. The choice of test should support a recommendation that reflects the users represented by the data. section 5.1 section 5.2.2


