Anomalous behavior detection rate (ABDR) measures the proportion of true anomalies detected among the abnormal behaviors identified by a detection system. It helps analysts judge whether monitoring distinguishes normal activity from genuine threats while limiting false positives. section 10.3.1
Use ABDR to interpret detection performance in operational context:
- Monitor baseline network traffic, user logins, and file transfers, then investigate deviations from expected behavior. section 10.3.1
- Treat a low rate as evidence that genuine anomalies may be missed, especially when false positives overwhelm analysts. section 10.3.4
- Improve results by fine-tuning detection algorithms and integrating real-time threat intelligence. section 10.3.4
SecureShield’s detection improvement
SecureShield began with an ABDR of 65%, while many anomalies went undetected and false positives burdened the system. After refining its anomaly detection algorithms and adding real-time threat intelligence, ABDR rose to 90%, indicating fewer missed anomalies and more precise detection. section 10.3.4
Figure 10.2 The left side shows the advanced threat detection metric dashboard for SecureShield before implementing improvements. On the right is the metrics after implementing dynamic risk scoring with anomaly detection and real-time threat intelligence feeds.
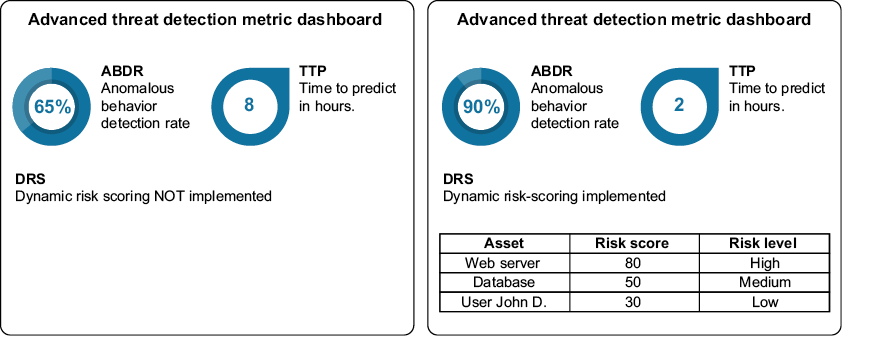
Compare the advanced threat detection dashboard before and after algorithm improvements, dynamic risk scoring, and real-time threat intelligence. section 10.3.4
