An applicability domain is the region of chemical or feature space where a predictive model is expected to make reliable predictions. In practice, this often means compounds resembling those used to train the model. Predictions for very different molecules require particular caution: the model may be extrapolating beyond the data it learned from. section 3.4.4
A test-set score estimates performance on the available test molecules; it does not establish reliability for every molecule a model might encounter. For example, a hERG blocker classifier achieved a test-set MCC of 0.452, but that score alone does not establish how it will perform on structures unlike those in the dataset. section 3.4.4
One way to assess a model’s domain is a Williams plot. It compares leverage, a measure of a data point’s influence on the model, with standardized residuals, which express observed prediction errors relative to their variance. Points with low leverage and small standardized residuals are considered within the domain. Because residuals require observed values, this assessment cannot be completed for a new compound whose outcome is unknown. section 6.3.1
An RNA-binding model
A Williams plot for a QSAR model of lnKoff identified one training ligand, DMZ-p8, outside the model’s applicability domain. In that plot, the bounds were standardized residuals of −3 and +3 and leverage of 3(p + 1)/n, where p is the number of model descriptors and n is the number of data points. section 6.3.1
Figure 6.12 Williams plot for applicability domain assessment of lnKoff. Bounds are defined as a standardized residual greater or less than +3 or -3, respectively, or a leverage that is greater than 3(p + 1)/n, where p is the number of descriptors in the QSAR model and n is the number of data points.
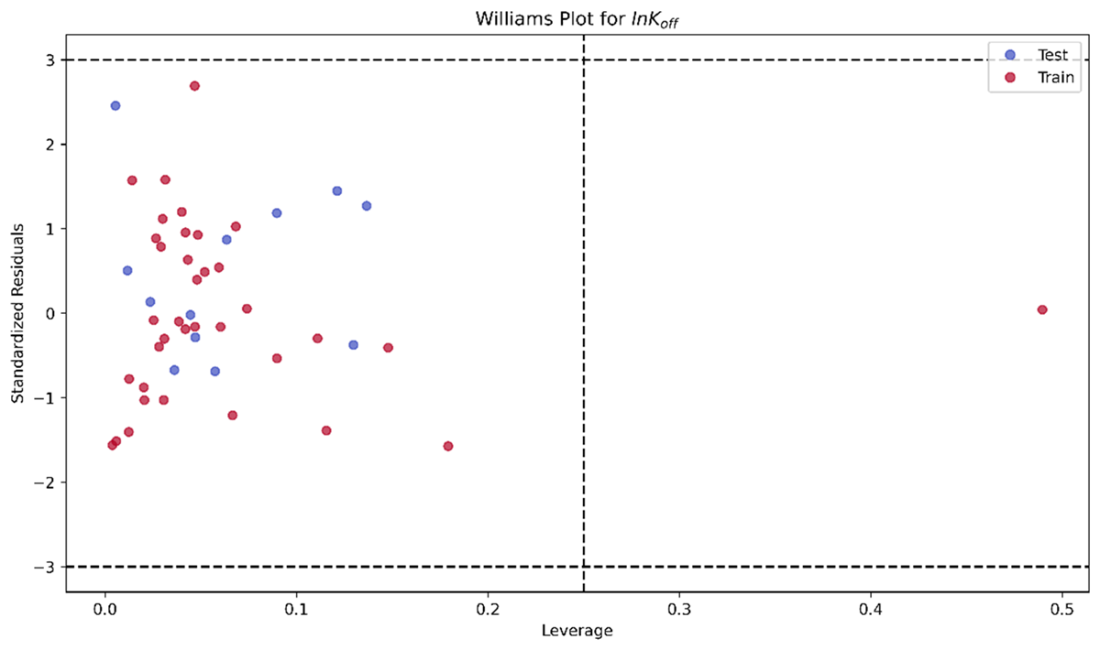
Inspect the Williams plot and its leverage and residual bounds for the lnKoff model. section 6.3.1
Before using a model to screen a compound library, compare the library’s chemical space with the training data. One option is to quantify the model’s applicability domain; another is to examine training–library overlap using dimensionality reduction such as UMAP. In an EGFR screening workflow, this check precedes activity prediction and ranking. section 8.1.3
