A bimodal distribution has two distinct peaks rather than one bell-shaped concentration. In anomaly analysis, this pattern can make a low standard deviation misleading: tightly packed values may still form two groups. section 7.1.2
Call-home timing
The variable time_difference_sec forms a bimodal distribution, with two peaks. Jitter introduced into call-home connections may change the observed shape, so analysts use quartiles and the interquartile range before calculating variance and standard deviation. section 7.1.2
Use the distribution shape to guide analysis:
- Check whether values follow a normal, unified distribution before relying on standard deviation. section 7.1.2
- Use the interquartile range to focus on values between the lower and upper quartiles and reduce sensitivity to outliers and skewed data. section 7.1.2
Figure 7.3 Distribution of time_diff_sec, taken from chapter 6
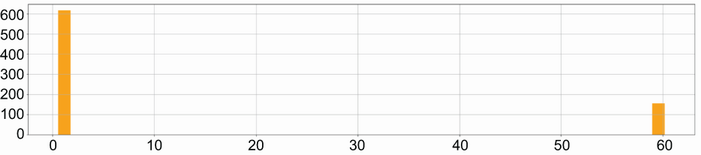
Inspect the plotted time_diff_sec distribution associated with the bimodal example. section 7.1.2
