Suppose you need to compare average sales prices or customer review scores across states, but your transactions are only a subset of the full data. A single average hides uncertainty about the wider population. Bootstrapping helps estimate a confidence interval instead of relying on that point estimate alone. section 3.4.4 section 4.8
To bootstrap, repeatedly draw random samples from the observed data, each as large as the original. Draw with replacement: a record can appear more than once in a sample. Calculate the statistic—such as a mean, median, or regression coefficient—for every sample. The resulting distribution of statistics is used to estimate a confidence interval. section 3.4.4
When more observations are costly
Imagine engineers can afford to destroy only 50 expensive devices to measure their breakpoint temperatures. Bootstrapping reuses those 50 observed results in many resampled datasets; it does not create another 50 physical tests. section 3.4.4
Before acting on an interval, check what it means:
- An interval communicates uncertainty; it does not identify the exact population average. Its width depends on sample size, confidence level, and variability in the data. section 4.8
- Check whether the records are a sample at all. If they cover the complete population of interest, calculate its average rather than estimate that average by bootstrapping. section 4.8
- Allow for execution cost: repeated sampling and recalculation can be computationally intensive. section 7.1
Listing 3.8 Calculating confidence intervals for sales and review scores by state
# Prepare datasets
# Merge df_products with df_product_category_translation
products_merged = pd.merge(
df_products, df_product_category_translation, on='product_category_name')

# Merge df_orders with df_order_items
order_items_merged = pd.merge(df_orders, df_order_items, on='order_id')

# Merge the resulting DataFrame with df_customers
order_customer_merged = pd.merge(
order_items_merged, df_customers, on='customer_id')

# Merge the resulting DataFrame with products_merged
order_product_merged = pd.merge(
order_customer_merged, products_merged, on='product_id')

# Merge the resulting DataFrame with df_sellers
order_seller_merged = pd.merge(
order_product_merged, df_sellers, on='seller_id')

# Merge the resulting DataFrame with df_order_reviews
order_review_merged = pd.merge(
order_seller_merged, df_order_reviews, on='order_id')

# Merge the resulting DataFrame with df_order_payments
analysis_df = pd.merge(
order_review_merged, df_order_payments, on='order_id')

# Choose a specific product category to analyze
product_category = "health_beauty"
filtered_df = analysis_df[
analysis_df['product_category_name_english'] == product_category]

# Group the data by seller state or city, and calculate
the metrics of interest
grouped_data = filtered_df.groupby('seller_state')
group_metrics = grouped_data.agg(
{'price': ['sum', 'mean', 'count'], 'review_score': 'mean'})

# Calculate the standard deviations
group_metrics['price', 'std'] = grouped_data['price'].std()
group_metrics['review_score', 'std'] = grouped_data['review_score'].std()

# Use bootstrapping to estimate the 95% confidence intervals for
the average sales revenue and average review score for each city or state.

import numpy as np
# Bootstrap the confidence intervals
def bootstrap_CI(data, func, n_bootstraps=1000, ci=95, axis=0):
    """
    Generate a confidence interval for a given statistic using
    bootstrapping.

    Parameters:
    data (numpy.ndarray or pandas.DataFrame):
    The data to calculate the statistic from.
    func (callable): The function used to calculate the statistic.
    n_bootstraps (int): The number of bootstrap samples to generate.
    ci (float): The confidence interval percentage (e.g., 95 for a 95% CI).
    axis (int):
    The axis along which to apply the statistic function
    (0 for columns, 1 for rows).

    Returns:
    tuple: The lower and upper bounds of the confidence interval.
    """
    bootstrapped_statistics = []
    for _ in range(n_bootstraps):
        bootstrap_sample = np.random.choice(
        data, size=len(data), replace=True)
        bootstrapped_statistic = func(bootstrap_sample, axis=axis)
        bootstrapped_statistics.append(bootstrapped_statistic)

    lower_bound = np.percentile(bootstrapped_statistics, (100 - ci) / 2)
    upper_bound = np.percentile(
    bootstrapped_statistics, 100 - (100 - ci) / 2)

    return lower_bound, upper_bound

# Create a new DataFrame to store the confidence intervals
def calculate_ci(group):
    return pd.Series({
        'price_ci_lower': bootstrap_CI(group['price'], np.mean,
        n_bootstraps=1000, ci=95)[0],
        'price_ci_upper': bootstrap_CI(group['price'], np.mean,
        n_bootstraps=1000, ci=95)[1],
        'review_score_ci_lower': bootstrap_CI(group['review_score'],
        np.mean, n_bootstraps=1000, ci=95)[0],
        'review_score_ci_upper': bootstrap_CI(group['review_score'],
        np.mean, n_bootstraps=1000, ci=95)[1]
    })

ci_df = grouped_data.apply(calculate_ci)

# Create visualizations with error bars for the average sales revenue and
average review score by seller state.

def plot_error_bars_only(df, metric_name, ylabel='', title='',
figsize=(10, 6)):
    fig, ax = plt.subplots(figsize=figsize)

    x = np.arange(len(df.index))
    y = df[metric_name + '_ci_lower'] + (df[metric_name + '_ci_upper'] –
    df[metric_name + '_ci_lower']) / 2
    yerr = (df[metric_name + '_ci_upper'] –
    df[metric_name + '_ci_lower']) / 2

    plt.errorbar(x, y, yerr=yerr, fmt='o', capsize=5, capthick=2,
    ecolor='black', elinewidth=2)

    plt.xticks(x, df.index, rotation=90)
    plt.xlabel('Seller State')
    plt.ylabel(ylabel)
    plt.title(title)
    plt.grid(axis='y')

    plt.show()

# Plot the confidence intervals
plot_error_bars_only(ci_df, 'price', ylabel='Average Sales')
plot_error_bars_only(ci_df, 'review_score', ylabel='Average Review Score')
The Python listing shows the data-joining workflow behind confidence intervals for state-level sales and review scores. section 3.4.4
Figure 4.6 Confidence intervals for (a) average sales price and (b) average review scores, for transactions in the “health and beauty” category of products
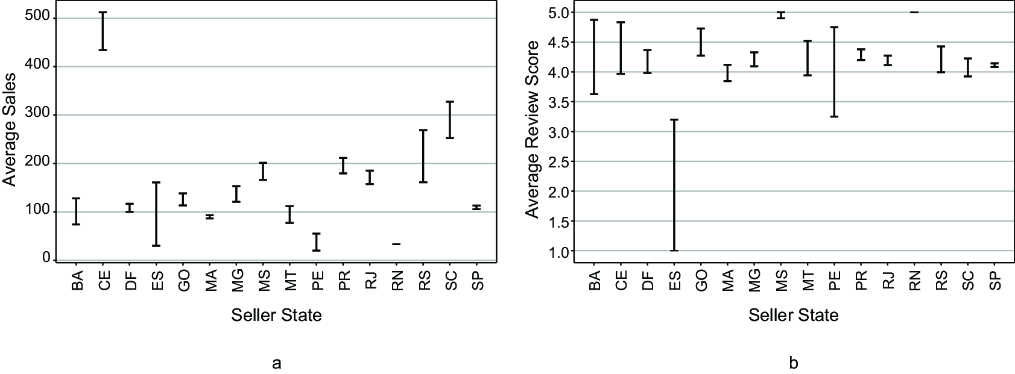
The figure displays state-level confidence intervals for average price and review score, making uncertain comparisons visible. section 4.8
