The bullwhip effect is the amplification of demand or ordering variability as it moves upstream through a supply chain. Even when end-customer demand is steady, manufacturers may face highly variable retailer orders; the variation generally increases at more upstream echelons. section 4.2
Five reinforcing causes commonly feed the effect:
- Order forecasting can distort the underlying demand signal. section 4.2
- Order batching and delayed orders create uneven ordering patterns. section 4.2 section 4.3.2
- Price fluctuations and promotions encourage irregular purchasing. section 4.2
- Shortage gaming causes customers to inflate orders when supply appears constrained. section 4.2
- Lead-time variation encourages higher safety stocks and larger orders, potentially creating a self-reinforcing capacity loop. section 4.2.5
Stable consumer demand, unstable manufacturing orders
A steady flow of diaper purchases can still produce highly variable orders at manufacturing sites. The beer game illustrates the same problem: each player manages one supply-chain echelon while seeing only direct incoming orders, not final demand. section 4.4 section 4.4
Figure 4.3 Bullwhip effect (the local sales pattern is illustrated above each stage; this is an illustration from my book Inventory Optimization: Models and Simulations).7
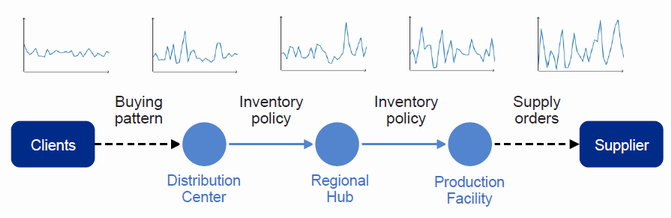
Use the echelon-by-echelon illustration to compare local sales patterns and observe how variability grows upstream. section 4.2
Figure 4.6 Vicious circle of supply constraints and safety stocks
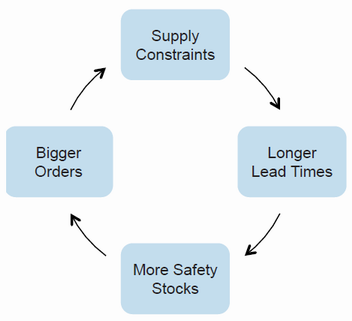
Trace how longer delays trigger larger safety stocks and orders, which can increase pressure on manufacturers and logistics centers. section 4.2.5
Figure 4.7 Four stages of information sharing and collaboration

Compare collaboration stages, from receiving orders without extra information to sharing sell-out and inventory data. section 4.3.2
