A causal arrow is a directed graph edge showing that one variable may affect another. In X → Y, changing X can affect Y, but changing Y does not change X. The arrow simplifies a potentially complex relationship: Y may be calculated as Y := f(X, U), where U represents unknown influences. section 3.1 section 3.2.2
The arrow answers a causal question rather than merely describing an association or making a prediction. It records a claim about what could change what, while leaving the exact mechanism to data or a more detailed model. An arrow may be drawn when an effect is certain or merely plausible; it is omitted only when a direct causal relationship is ruled out. section 2.2.1 section 3.2.2
Kidney stones and recovery
Suppose stone size affects recovery, giving Size → Recovery. If doctors also use size when choosing treatment, the graph includes Size → Treatment, while Treatment → Recovery represents the treatment effect. The graph therefore determines which variables matter and whether an adjustment formula is needed. Reversing the direction between Size and Treatment would describe a different causal story and change the calculation. section 3.1
Use arrows to make causal assumptions explicit:
- Connect variables with an arrow when one may directly affect the other; leave unrelated pairs unconnected when a direct effect is ruled out. section 3.2.2
- Treat missing arrows as assumptions, not as proof that variables are unrelated in every possible way; indirect paths may still connect them. section 2.2.1 section 3.2.2
- Review variables, arrow placement, and directions with domain experts, especially when measurements are imperfect or proxies are used. section 3.1 section 3.2.3
Figure 3.6 Graph showing the effect of Topic on Pageviews. Seasonality and Popularity are confounders, and Platform is a mediator.
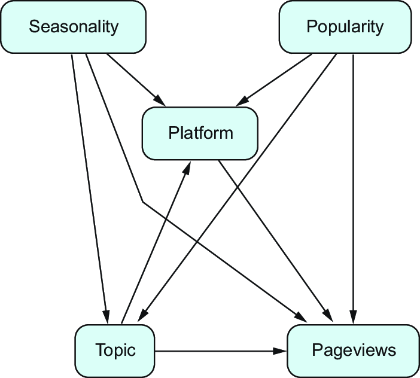
A graph of Topic, Pageviews, Seasonality, Popularity, and Platform shows how arrows distinguish confounders from mediators and organize a practical causal question. section 3.2.2
