A causal model represents how variables produce one another so that a causal effect—not merely an association—can be estimated. It identifies a cause, an outcome, and factors such as confounders that influence both. The model is shaped by a specific goal and by assumptions about how the relevant part of reality works. section 1.1.3 section 1.1.4
Directed acyclic graphs (DAGs) are a common representation: variables are nodes, causal relationships are arrows, and mediators and confounders can be made explicit. Equations provide another representation. A useful model includes enough relevant factors to support its goal, without adding complexity whose assumptions or computation cannot be handled reliably. section 1.1.3 section 7.0
Build and assess a causal model as a practical argument about an intervention:
- State the causal question and estimand, then distinguish it from a prediction question about patterns continuing as before. section 1.2 section 4.1.1
- Identify plausible confounders from knowledge of how decisions and outcomes arise; variable selection is not a cross-validation exercise. section 4.1.1 section 4.1.5
- Make assumptions explicit and review the graph with domain experts and other stakeholders to uncover omitted variables or incorrect relationships. section 1.1.4 section 4.1.6
- Seek intervention evidence such as an A/B test when possible; otherwise use several independent studies and the strongest defensible account of reality. section 4.1.6
Discounts, loyalty, and purchases
An online store may observe that discounted items are more often purchased because loyal customers receive discounts. A model using price alone can predict purchases under the existing policy, but can fail after discounts are offered broadly: price no longer carries the same information about loyalty. Including loyalty represents the mechanism needed to ask how changing price affects purchasing. section 4.1.4
Why low prediction error is insufficient
In a synthetic Pac-Man level dataset, bonuses and ghosts are correlated because both reflect the designer’s process. A regression using bonuses alone has nearly the same fit as one using bonuses and ghosts, yet gives a substantially different prediction for a changed level. The missing relevant variable distorts the estimated effect despite strong predictive accuracy. section 4.1.5
For a more formal view, a causal model separates endogenous variables of interest from exogenous, unobserved factors. Each endogenous variable is described by a function of its parent variables and its exogenous factors. This modular view supports analyzing relevant subsystems rather than modeling the entire world. section 7.1.3
Figure 7.7 Typical three-node DAG with confounding. Z is a confounder for X and Y.
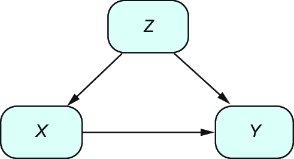
Use the three-node DAG to inspect a basic confounding structure: Z affects both X and Y, so estimating the effect of X on Y requires accounting for Z. section 7.1.3

