A center line (CL) is the horizontal reference level for the process being monitored. It represents the process mean, allowing plotted measurements to be compared with expected central behavior and helping reveal shifts, trends, or unusual variation. section 14.1.2
The metric depends on the control chart. A p-chart uses the mean proportion defective, a c-chart uses the average number of defects, and an I-chart uses the mean of individual measurements. An EWMA chart uses the overall EWMA mean as its CL. section 14.2.1 section 14.2.3 section 14.3.4 section 14.3.5
Use the center line to interpret process behavior:
- Compare observations with the central process level rather than with the control limits alone. section 14.1.2
- Interpret persistent movement around the CL as possible evidence of trends or shifts requiring investigation. section 14.1.2 section 14.3.5
- Read the CL together with UCL and LCL; observations beyond those boundaries may signal an out-of-control process. section 14.2.1 section 14.3.5
EWMA center line
For piston-ring diameters measured across 40 samples, the EWMA line gives greater weight to recent measurements. The CL is the overall EWMA mean, while UCL and LCL define the expected variation range. section 14.3.5
Figure 14.9 This EWMA chart displays the exponentially weighted moving average of piston ring diameters across 40 samples. The chart shows how the process mean evolves over time, with recent data points having more influence on the chart’s trajectory than older ones. The CL represents the overall EWMA mean, whereas the UCL and LCL indicate the expected range of variation. Data points within these limits suggest the process is under control, whereas any point outside may signal a shift or trend that requires further investigation.
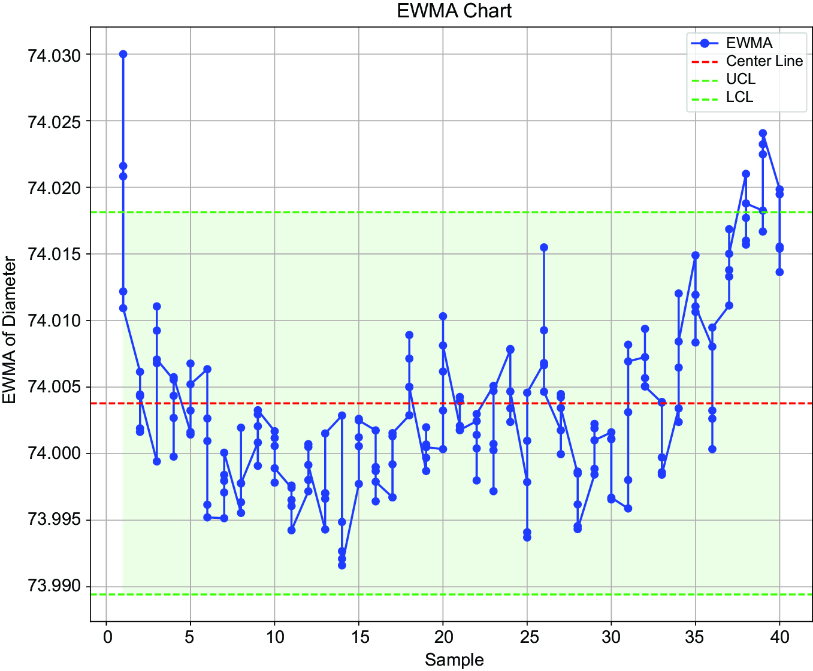
Inspect the EWMA chart showing the center line alongside the weighted process trajectory and control limits. section 14.3.5
