Central tendency is a way to describe a typical or central value in a dataset. The mean, median, and mode each reduce a distribution to one value, making them useful for quick assessments, reports, and dashboards. That convenience has a cost: a single number can hide outliers, skew, or distinct groups of values. section 4.1.1 section 3.2.1
Choose a measure that fits the distribution and the question:
- Mean: useful when data is roughly symmetrical and has a meaningful center, but sensitive to skew and extreme outliers. section 4.1.1 section 4.1.2
- Median: useful for skewed or asymmetrical data because it emphasizes the relative position of values rather than extreme observations. section 4.1.2 section 4.1.1
- Mode: the most frequently occurring value; useful when many values concentrate in a representative bin. Report another measure alongside it, and inspect the distribution for multiple peaks. section 4.1.1 section 4.1.2
Before reporting a typical value, inspect the distribution’s shape and ask whether it has a meaningful center. Compare central tendency with measures of spread and a visualization. If no single center describes the data well, report the range, median, and interquartile range with a distribution plot instead. Check these properties before using inferential statistical tests. section 4.1.1 section 4.1.2
Figure 4.8 The mean (black dotted line) and median (gray dashed line) are approximately identical in the first and third distributions. The measures noticeably deviate in the second skewed distribution.
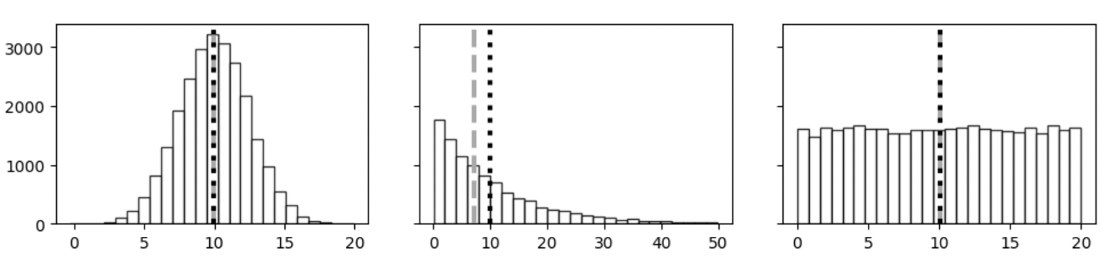
Compare where the mean and median fall across distributions: their separation in the skewed case shows why the choice of a typical value matters. section 4.1.1
Daily sightings, monthly summaries
For daily rat-sighting reports, monthly means and medians can be plotted together. The comparison gives stakeholders more context than either monthly value alone when assessing how typical daily counts change over time. section 3.2.1
The same check matters when setting metric baselines: compare central values across customer segments and time periods, then look for outliers or overlapping distributions before treating a difference as meaningful. For monthly customer logins, regional histograms and average activity over time provide context for a reported average. section 7.2.2
