An x-bar chart monitors a process mean over time by plotting subgroup means against an overall mean and control limits. It helps determine whether a continuous manufacturing process remains stable and predictable. section 14.3.1
Construct an x-bar chart by:
- Grouping measurements by sample or batch and calculating each subgroup mean with pandas. section 14.3.1
- Calculating the overall mean of the subgroup means as the chart’s center line. section 14.3.1
- Setting control limits three standard deviations above and below the overall mean, using the standard deviation of subgroup means. section 14.3.1
- Investigating subgroup means outside the limits because they may indicate an assignable cause or an out-of-control process. section 14.3.1
Piston-ring diameters
A dataset contains 200 piston-ring diameter measurements divided into 40 samples of five measurements each. Plotting the 40 sample means against three-standard-deviation control limits reveals whether average diameter remains consistent across batches. section 14.3 section 14.3.1
Figure 14.5 This x-bar chart displays the mean diameter of piston rings across 40 samples, with control limits set at three standard deviations from the overall mean. The chart helps monitor the consistency of the manufacturing process, ensuring that the average diameter remains within acceptable limits, signaling that the process is stable and in control.
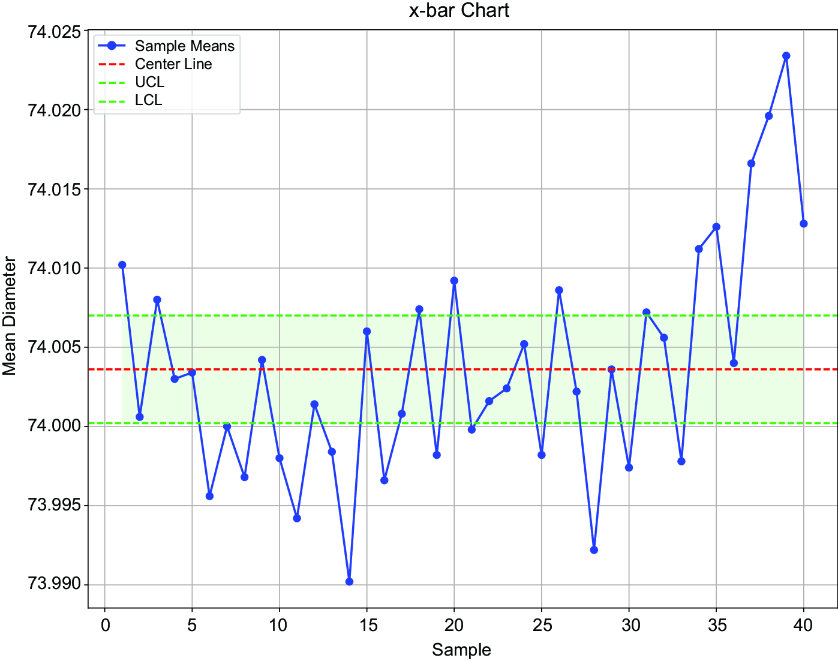
Use the chart to inspect subgroup means, the center line, and control-limit crossings visually. section 14.3.1
