An r-chart, or range chart, monitors within-sample process variability by plotting each sample’s range over time. It complements an x-bar chart, which monitors process means. section 14.3.2
Construct and interpret an r-chart by following these steps:
- Group measurements into samples and calculate each range as the sample maximum minus its minimum. section 14.1.4
- Calculate the average range across samples, then establish upper and lower control limits three standard deviations above and below it. section 14.3.2
- Investigate ranges outside the limits or visible increasing and decreasing patterns, because they may indicate changing process dispersion. section 14.3.2
- Use the r-chart with an x-bar chart when both variability and process mean require monitoring. section 14.3
Piston-ring diameter monitoring
For 200 piston-ring diameter measurements divided into 40 samples of five measurements, the r-chart plots the range for each sample. All ranges remain within the control limits, indicating stable variability; the x-bar chart must still be checked because several sample means are out of control. section 14.3.2
Figure 14.6 This r-chart displays the range of piston ring diameters across 40 samples, with control limits set at three standard deviations from the mean range. The chart helps monitor the variability in the process, indicating that all of the sample ranges fall within the control limits, suggesting the variability in the process is stable.
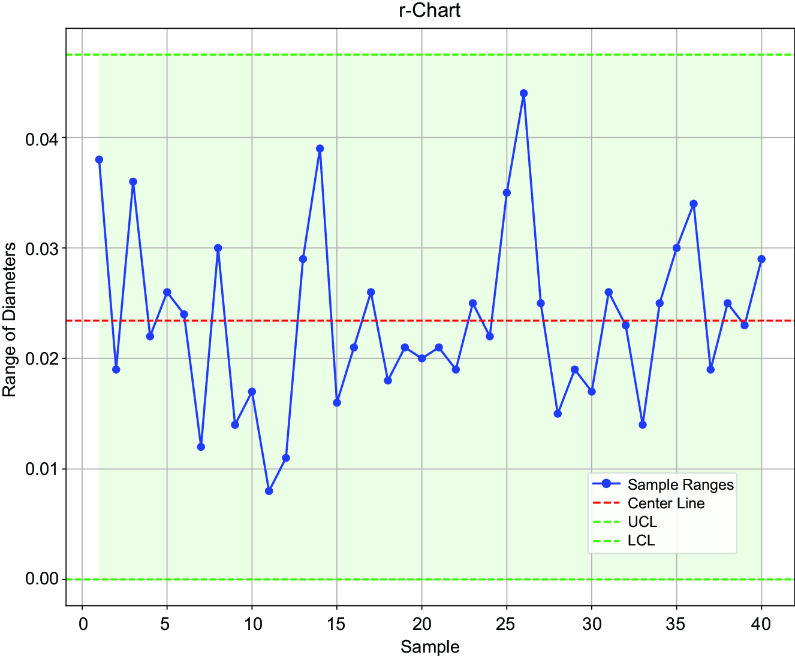
The figure provides a visual reference for sample ranges, the average range, and three-standard-deviation control limits. section 14.3.2
