A chain is a three-node directed path whose arrows point consecutively in one direction: X→Y→Z or X←Y←Z. In a causal graph, the middle node transmits association between the endpoints. section 7.1.4
Rain, wet streets, and dirty floors
Let X mean rain, Y a wet street, and Z shoes making the floor dirty. Because Z depends on Y, knowing Y makes the details of X irrelevant: P(Z|Y,X) = P(Z|Y). Thus X and Z are conditionally independent given Y, and conditioning on Y blocks the path. section 7.1.4
A chain can carry correlation between its endpoints even when conditioning on the middle node removes it. In synthetic data, X and Z had correlation 0.32 overall, but correlations near zero after separating observations by Y. section 7.1.4
Use the chain pattern when reasoning about paths in a DAG:
- Conditioning on the intermediate node blocks the chain between the endpoints. section 7.1.5
- Distinguish chains from forks and colliders: forks have arrows pointing away from a common cause, while colliders have arrows pointing into a common effect. section 7.1.4
- When seeking d-separation, block every relevant path with a chain or fork node, but avoid conditioning on a collider or its descendant unless another variable closes the opened path. section 7.1.6
Table 7.2 Chain DAG
|
DAG
|
Equations
|

|
|
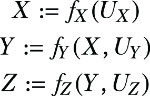
Inspect the chain DAG and its structural equations for the rain–street–floor example. section 7.1.4
Listing 7.1 (R) Creating a synthetic dataset with the structure of a chain
set.seed(1234)
n <- 10000
x <- rbinom(n, 1, 0.5)
y <- x * rbinom(n, 1, 0.3) + (1-x)*rbinom(n, 1, 0.7)
z <- y * rbinom(n, 1, 0.1) + (1-y)*rbinom(n, 1, 0.9)
cor(x, z)
Run the R data-generating process that creates a synthetic chain. section 7.1.4
Listing 7.2 (Python) Creating a synthetic dataset with the structure of a chain
from numpy.random import seed, binomial
from numpy import corrcoef
seed(1234)
n = 10000
x = binomial(1, 0.5, n)
y = x * binomial(1, 0.3, n) + (1 - x) * binomial(1, 0.7, n)
z = y * binomial(1, 0.1, n) + (1 - y) * binomial(1, 0.9, n)
corrcoef(x, z)[0][1]
Run the Python equivalent of the synthetic chain simulation. section 7.1.4
