A chi-square test is a non-parametric test for categorical data. It compares observed frequencies with frequencies expected under a null hypothesis of no differences between categories. section 5.2.3
Choose the form that matches the research question:
- Goodness-of-fit compares observed frequencies in one sample with expected frequencies. section 5.2.3
- The test of independence compares two categorical variables using observed and expected frequencies in a contingency table. section 5.2.3
- The test for trend evaluates patterns in a categorical variable across time or groups. section 5.2.3
Figure 5.11 Comparisons of two categorical variables can be presented as a contingency table, pivoting the results into summarized rows and columns you can easily view.
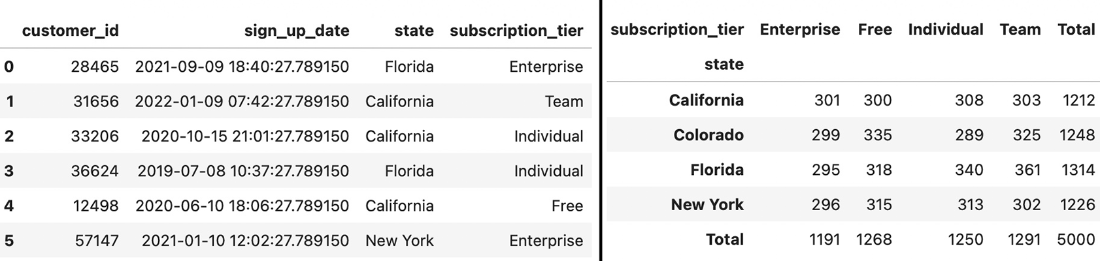
Use a contingency table to organize counts for each combination of two categorical variables before comparing observed and expected frequencies. section 5.2.3
Recommendation clicks by country and experiment group
A recommender experiment organizes users by recommender version and country, then compares observed clicks with expected counts. The overall test reports a chi-square value of 22.994 and a p-value of 0.028. Pairwise comparisons report differences between versions A and B, A and C, and B and C; interpret such multiple comparisons with safeguards against false positives. section 5.2.3 section 5.4


