Complexity is not just the amount of code in a system. Business rules, workflows, integrations, data, technology, and the interactions between components can all make change harder to understand and carry out. A small-looking user experience problem may reach through several architectural layers: a character limit, for example, can be enforced by an XML schema and multiple databases. section 6.3.5 section 1.0 section 3.1.5
Assess complexity at the scale of the decision. For a subdomain, model complexity approximates the effort to discover user needs, design and implement a model, evolve it, and support the software. There is no precise formula: a reasoned assessment by business, product, domain, and technical participants is more useful than one person's score. Operational complexity can also matter, but is usually considered separately and annotated when needed. section 10.2.2 section 10.5
Use complexity as a prompt for questions, not a verdict:
- Which business rules, workflows, scalability demands, or old technologies make this area difficult? Would assigning several such domains to one team exceed its cognitive load? section 6.3.5
- Is the difficulty valuable? A highly complex, differentiating subdomain may justify focused investment; high complexity with little differentiation may instead signal accumulated cruft and maintenance cost. section 10.2 section 10.3.7
- Would a proposed boundary reduce complexity overall, or merely move it into interactions between components? Revisit the answer as the system and business change. section 12.1.1 section 10.2.3
A Core Domain Chart places candidate subdomains against model complexity and business differentiation to support investment choices. It captures strategic choices rather than the full network of dependencies; Wardley Mapping offers a broader landscape and value chains. Use the chart after identifying candidate subdomains, and revise it as understanding improves. section 10.2 section 10.2.5 section 9.2.6
When smaller boundaries made the system harder
In an accounting-system modernization, a group tested proposed boundaries against real use cases and redrew them several times. Its initial fine-grained design gave way to fewer, larger subsystems. The group found that this improved cohesion and reduced interactions between boundaries: lower global complexity mattered more than making every subsystem small. section 12.2.3
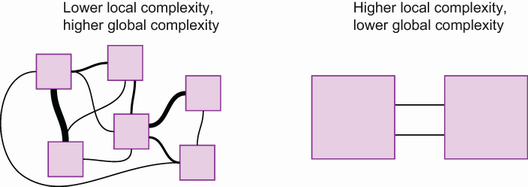
The diagram helps compare complexity inside a component with complexity created by interactions across the whole system. section 12.1.1
Treat any assessment as provisional. Legacy behavior and edge cases can emerge after modernization begins, changing apparent domain boundaries and costs. Discuss likely surprises with stakeholders, test boundaries through focused workshops and concrete scenarios, and adjust the plan rather than assuming a linear path. section 9.3.4 section 2.1.3 section 12.2.3