Model calibration describes whether predicted probabilities agree with observed outcome frequencies. For a well-calibrated inhibitor model, roughly 80% of molecules assigned a probability near 0.8 should actually be inhibitors. The probability describes a group of similar predictions, not a guarantee about one molecule. section 5.1.3
A sigmoid function puts a model’s output between 0 and 1, but that alone does not make the result a reliable probability. Miscalibration can make decision thresholds misleading: an inflated toxicity estimate, for example, could cause a promising compound to be rejected. section 5.1.3
Use a reliability diagram to assess calibration:
- Group predictions into probability bins, such as 0–10%, 10–20%, and so on. section 5.1.3
- Compare the predictions in each bin with the observed frequency of the outcome. Large gaps indicate miscalibration. section 5.1.3
- Summarize discrepancies with a calibration error metric, or use the Brier score to measure squared differences between individual probabilities and outcomes. section 5.1.3
Figure 5.2 Reliability diagram with error bars for logistic regressor trained on CYP 3A4 data set. Probability estimates, RMSCE, and BS derived from predictions on validation set.
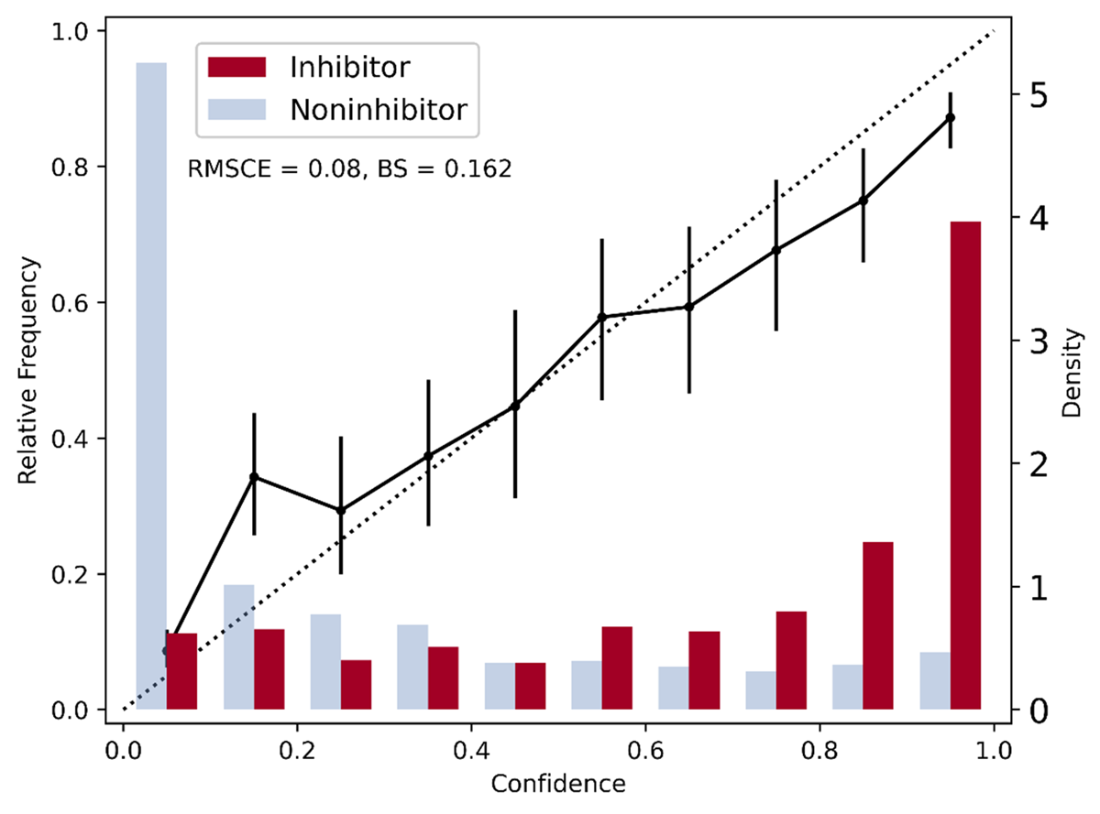
This reliability diagram shows validation-set probability estimates for a logistic regressor predicting CYP3A4 inhibition, with error bars and summary scores. section 5.1.3
Calibration can also be applied after training. Platt scaling and isotonic regression fit a mapping using labeled validation predictions. Evaluate the resulting probabilities on a separate test set rather than the data used to fit the mapping. section 5.1.3
Listing 5.2 Calibration with Platt Scaling & Isotonic Regression
from sklearn.calibration import CalibratedClassifierCV
from sklearn.frozen import FrozenEstimator
from utils import reliability_diagram

lr_ps_cal = CalibratedClassifierCV(
    FrozenEstimator(lr_model), method='sigmoid'
)
lr_ps_cal.fit(val_fingerprints, val_df.Inhibitor)
test_proba_ps = lr_ps_cal.predict_proba(test_fingerprints)[:, 1]
ax, ax1 = reliability_diagram(test_proba_ps, test_df.Inhibitor, nbins=10)

lr_ir_cal = CalibratedClassifierCV(
    FrozenEstimator(lr_model), method='isotonic'
)
lr_ir_cal.fit(val_fingerprints, val_df.Inhibitor)
test_proba_ir = lr_ir_cal.predict_proba(test_fingerprints)[:, 1]
ax, ax1 = reliability_diagram(test_proba_ir, test_df.Inhibitor, nbins=10)
This Python listing freezes a trained logistic regressor, fits sigmoid and isotonic calibrators on validation data, and plots their test-set reliability diagrams. section 5.1.3
Figure 5.3 Reliability diagram for the logistic regressor after undergoing calibration via platt scaling or isotonic regression.
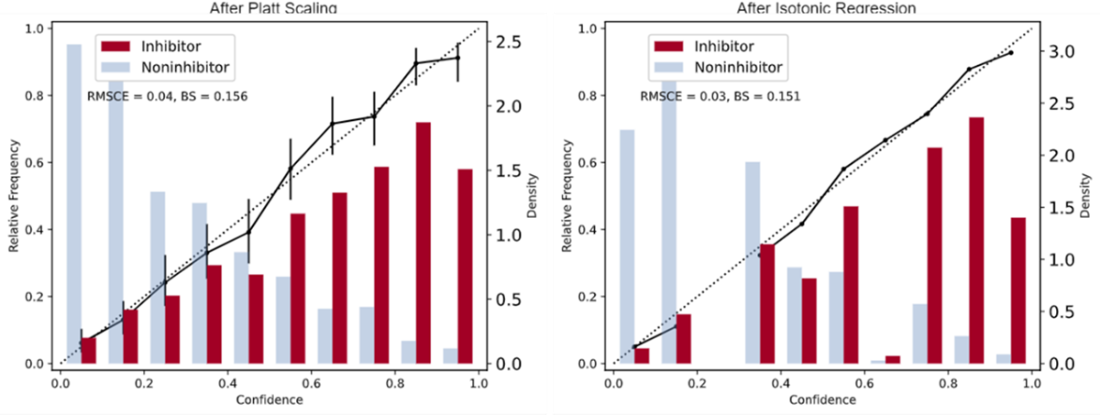
Compare the reliability diagrams after Platt scaling and isotonic regression. section 5.1.3
In multiclass or multilabel prediction, different classes or labels can have different calibration and optimal thresholds. These differences can affect the ranking of labels, especially with independently trained models, more complex models, or greater data imbalance. section 5.4.2