A continuous hypothesis space contains candidate values across a numerical range, so nearby possibilities such as p = 0.2 and p = 0.200001 can differ infinitesimally. section 3.2
Instead of adding probabilities for finitely many hypotheses, use an integral to measure the area under a probability curve. The total area must equal 1. section 3.2
Keep these distinctions in mind:
- A probability mass function assigns exact probabilities to discrete hypotheses. section 3.2
- A probability density function describes relative likelihood across continuous hypotheses; integrating it gives the probability of a range. section 3.2
A probability between zero and one
A uniform continuous distribution over 0 to 1 treats every candidate value as equally likely, with its density normalized by integration. section 3.2
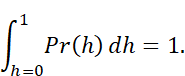
Use the equation view to inspect how integration replaces summation and normalizes continuous probability. section 3.2
