Continuous profiling continuously samples an operating system or service to reveal resource usage and function execution times over time. It supports troubleshooting, performance optimization, and comparisons between service versions, such as measuring the cost of a new feature. Unlike logging, it produces numerical measurements; unlike distributed tracing, it focuses on execution within a service or machine rather than a request crossing services. section 9.1 section 2.5
Continuous profiling is commonly used to:
- Locate CPU-heavy functions, memory consumption, heap allocations, goroutines, and other execution characteristics. section 9.1 section 9.1.1
- Compare current behavior with previous service iterations to assess performance and resource trade-offs. section 9.1
- Collect profiles automatically through eBPF or profile-producing HTTP endpoints, with formats such as protobuf-encoded pprof. section 9.1.3 section 9.4
Finding a slow Go function
A Go service exposes pprof through net/http/pprof while quickTask and slowTask consume CPU. Running go tool pprof against a 30-second CPU profile opens an interactive shell; the cumulative listing shows main.slowTask using almost half of the sampled runtime, while main.quickTask uses less than 6%. section 9.1.1
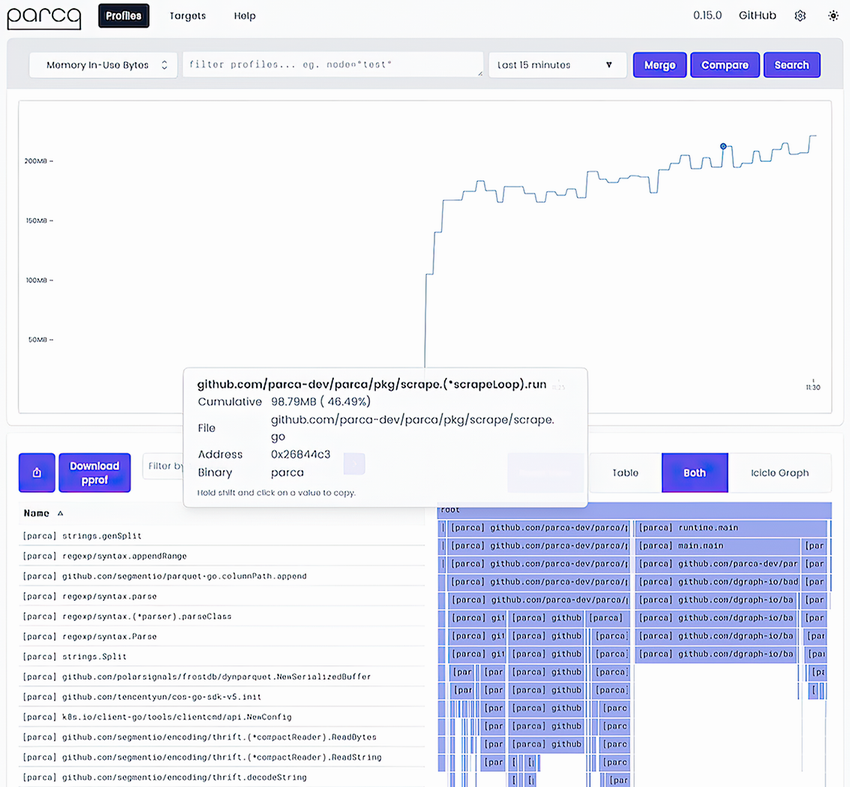
Inspect a Parca view of profiles collected from an OpenTelemetry collector, including line charts and an Icicle Graph for call-stack analysis. section 9.1.5
A practical setup combines a profile source, a collector or scraper, and storage and query capabilities. Parca can scrape profiles from an OpenTelemetry collector configured with its pprof extension, while Docker Compose supplies the local stack. Open-source tools such as Parca, Pixie, and Pyroscope provide ways to evaluate the approach before considering commercial offerings. section 9.1.3 section 9.1.5 section 9.4
Production use requires a case-by-case decision. Debug symbols can alter execution time and resource usage, while tracking, ingestion, storage, latency, and profile-query infrastructure add operational cost. The usefulness of the insight must outweigh those effects for the workload. section 9.3.6
