liveBook · Manning

Developer observability

As explained in Cloud Observability in Action

Developer observability is the practice of providing developers with telemetry-derived insight into code changes and their effects on applications.

Developer observability uses telemetry signals to give developers actionable insight into code changes and their effects on application performance, runtime behavior, and resource usage. section 9.0 section 9.4
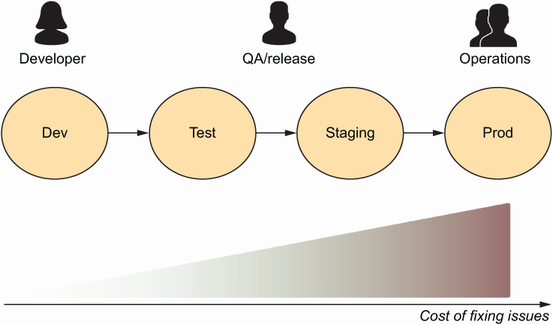
Figure 9.1 Shift left

Shift left moves observability-related responsibilities toward developers, rather than leaving testing, deployment, and operational insight entirely to other roles. section 9.0

Developer observability supports several practical workflows:

  • Debug code and accelerate development with telemetry-derived feedback. section 9.4
  • Understand a new feature’s runtime and resource-usage impact, including changes between service versions. section 9.4
  • Use CI/CD pipelines, OpenTelemetry-based tools, continuous profiling, or tools such as Digma and Sprkl as signal sources or implementations. section 3.5 section 9.4

How Cloud Observability in Action covers it

How deep it goes
Defines the practice, explains shift-left responsibilities, and names signals and tools without detailing implementation procedures.
Examples
Uses code changes, feature impacts, service-version comparisons, CI/CD signals, and tools such as Digma, Sprkl, Parca, Pixie, and Pyroscope.
What it assumes
Assumes basic observability and development-process concepts while distinguishing developer audiences from operations-focused production observability.
What you can do after
Apply telemetry and profiling insights to debug code and evaluate performance or resource-use changes.
How it connects
Connects observability with telemetry, CI/CD, continuous profiling, OpenTelemetry, and developer productivity.

Related concepts

This explainer was generated by Manning's knowledge graph from the text of Cloud Observability in Action. The section links point to the parts of the book it draws on.