Observability data is telemetry describing whether a software system operates correctly and efficiently. It includes metrics, logs, and traces used to understand healthy states, diagnose failures, and detect outages. section 5.1.3 section 5.3.3
Useful observability data supports three progressively harder situations:
- Known-knowns: telemetry, queries, and alerts identify violations of understood healthy states, such as sustained CPU above 90% or excessive API concurrency. section 5.1.3
- Known-unknowns: telemetry exposes failures whose general conditions are understood but whose specific causes or inputs are not fully predictable. section 5.1.3
- Cross-platform collection: aggregating signals externally reduces dependence on any single cluster and preserves alerting during internal platform failures. section 5.3.3
External monitoring for multiple clusters
A platform team operating several Kubernetes clusters can place dashboards and collectors on dedicated infrastructure, then use Datadog or PagerDuty to monitor both the clusters and the observability platform. An internal outage can therefore still produce an external alert. section 5.3.3
Figure 5.3 Knowing what to look for when querying observability data is an evolving process.
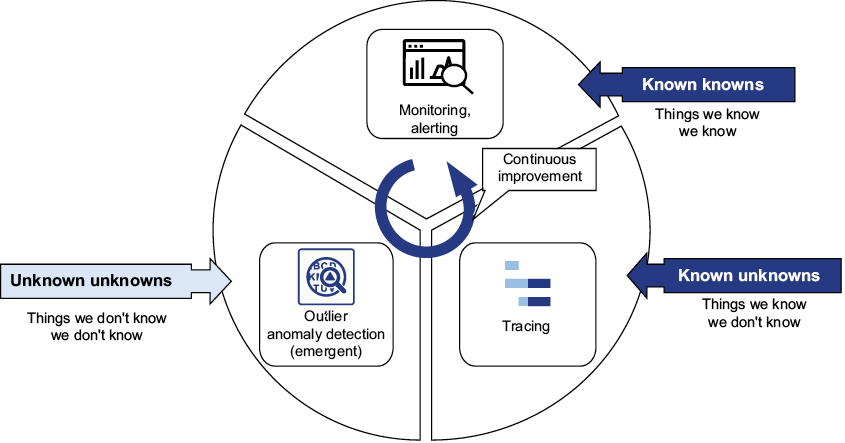
Use the figure to track how querying observability data evolves as teams learn which signals and failure conditions matter. section 5.1.3
