Signal correlation is the metadata-driven process of connecting different observability signal types to gain actionable insights faster or more accurately. Metric–log correlation starts with an aggregated metric and finds log lines from the services contributing to that value. section 11.1 section 11.1.3
Correlation follows a path between signals. A dashboard metric can lead to traces, then to service logs or profiles; metadata such as resource attributes, labels, trace identifiers, versions, regions, and environments supplies the connective tissue. section 11.1.1 section 11.6
Common operational uses include:
- Incident response: move from an increased error-rate metric to traces identifying failing services, then inspect their logs. section 11.0
- Root-cause analysis: combine metrics about regions or compute environments with logs containing service and library versions. section 11.0
- Service improvement: use traces to identify the request path and correlate profiles across service versions. section 11.0
Metric to trace to logs
An on-call engineer sees elevated errors in a Grafana Prometheus dashboard, follows a trace ID stored in a metric exemplar into Jaeger, and drills into service logs to verify the suspected upgrade-related failure. A simpler alternative is time-based correlation: query several backends over the same period and manually connect the signals. section 1.5.2 section 11.2.2
Exemplar-based implementation
A Prometheus-compatible metric can embed a trace identifier, such as traceID="a6427ef2021cce03". OpenMetrics exposes the exemplar, Prometheus stores it, Grafana renders it, and a click opens the representative Jaeger trace. The setup enables OpenMetrics and exemplar storage and routes metrics and traces through an OpenTelemetry Collector. section 11.2 section 11.2.1
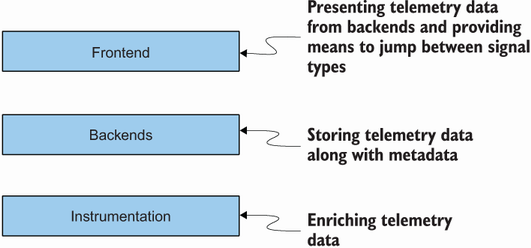
The correlation stack shows how instrumentation, metadata-aware backends, and presentation layers support increasingly automated signal transitions. section 11.1
