A core domain chart helps a group decide where architecture modernization will have the greatest business impact. It treats subdomains as a portfolio of investment opportunities rather than assuming every part of a system deserves the same attention. The chart positions each subdomain by business differentiation and model complexity: the effort needed to discover, design, build, and maintain its software model. section 10.0 section 10.2
The position helps distinguish three kinds of subdomain:
- Core domains are highly differentiating and complex. They are candidates for substantial investment and are nearly always built in-house. section 10.2 section 10.5
- Supporting subdomains help core domains differentiate but offer less differentiation on their own. Their company-specific logic typically favors in-house development. section 10.2 section 10.5
- Generic subdomains have little differentiation potential. Off-the-shelf solutions often make more sense than building them in-house. section 10.5
Start with candidate subdomains and bring domain, business, product, and technical experts together. Discuss each subdomain’s contribution to the business strategy and the complexity of its model, then place it relative to the others. The conversation matters as much as the resulting picture: positions express a shared assessment, not a permanent verdict. Use the chart to question where to invest financially, organizationally, and technically. section 10.2 section 10.0
Choosing among scooter-company initiatives
A shared-scooter company wants more rides and more enjoyable journeys. Its candidates include better scooter placement, a loyalty program, and robot tour guides. Placement could substantially increase rides, but a richer calculation engine and new data sources make it complex. The tour-guide idea might be revolutionary, yet evidence for its impact is limited. Plotting such opportunities makes both strategic promise and uncertainty discussable before committing investment. section 10.2.1
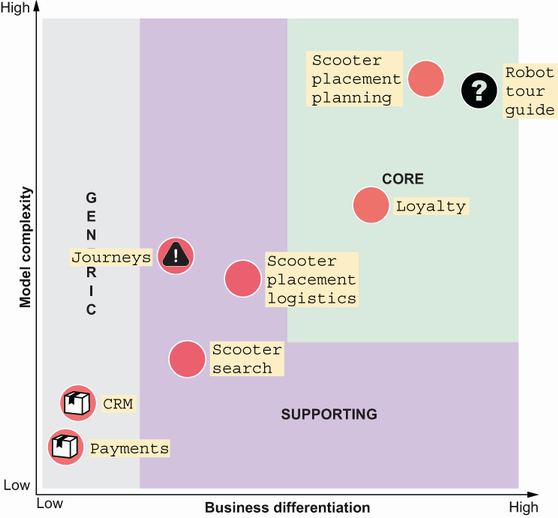
See how the scooter company’s candidate subdomains are positioned by their perceived strategic significance. section 10.2.1
Add arrows to show a proposed direction of investment or an expected shift over time. Moving upward can represent accepting more complexity to increase differentiation; moving downward can represent reducing complexity and cost. Revisit the chart as markets and priorities change. At portfolio level, look for warning signs such as too many claimed core domains, generic capabilities built in-house, or team sizes that suggest more investment in supporting than core domains. section 10.2.3 section 10.3.10
A core domain chart focuses on decisions about an organization’s subdomains. Wardley Mapping provides a broader landscape, including value chains and stages of evolution. Use the chart when the immediate question is which subdomains warrant strategic investment; use the broader map when the relationships and context behind differentiation need examination. section 10.2.5
