A covariance matrix summarizes how multiple random variables vary together. In a multivariate Gaussian, its diagonal contains each variable’s variance, while entry i,j contains the covariance between variables Xi and Xj. section 2.2.1
Read the matrix by separating individual uncertainty from relationships:
- Diagonal entries describe the variance of the corresponding variables. section 2.2.1
- Off-diagonal entries describe covariance, indicating how two variables change together; larger positive values represent stronger positive association. section 2.2.1
- In high-dimensional data, nearby variables can have larger covariances while distant variables have covariances near zero. section 2.2.3
Housing prices along a street
Treat house prices as variables in a 20-dimensional Gaussian. Neighboring houses may have covariance around 0.87, whereas houses at opposite ends may have covariance near zero. Observing one house’s price therefore provides more information about nearby prices than distant ones; conditioning updates their means and reduces their uncertainty. section 2.2.3
Figure 2.10 Heat map showing the covariance matrix of a 20-dimensional Gaussian distribution. Neighboring variables are more correlated than those that are far away, as indicated by a darker shade.
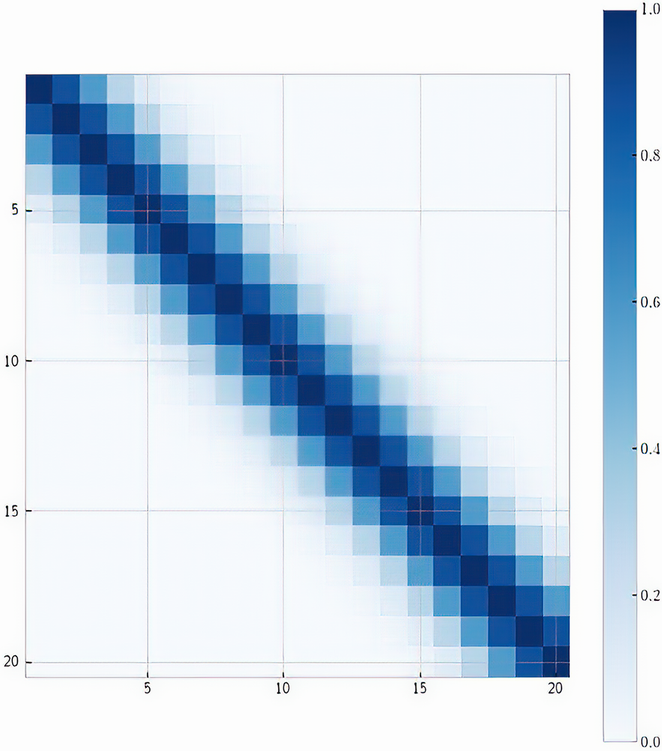
A covariance heat map makes the relationship structure visible: darker neighboring entries indicate stronger covariance, while distant pairs approach zero. section 2.2.3




