A covariance matrix summarizes the shape of multidimensional data. For d features, it is a d × d matrix: diagonal entries give each feature’s variance, while other entries give pairwise covariances. Together with a data center, it describes a multivariate Gaussian and supports ellipses that follow the data’s spread and correlations. section 5.5
That shape matters in outlier detection. Two points can be equally far from the center by Euclidean distance yet differ in how unusual they are relative to the data. Mahalanobis distance incorporates the inverse covariance matrix to measure distance with the feature variances and correlations taken into account. section 5.5 section 5.5.1
Figure 5.6 The middle pane is an example of using Euclidean distance from the center of a dataset to measure the outlierness of datapoints. Here, point A is a stronger outlier than point B but is the same distance from the center using Euclidean distance. The right pane is an example using distances based on fitting an ellipse to the data and provides more meaningful distance measures, allowing us to consider A farther from the center than B.
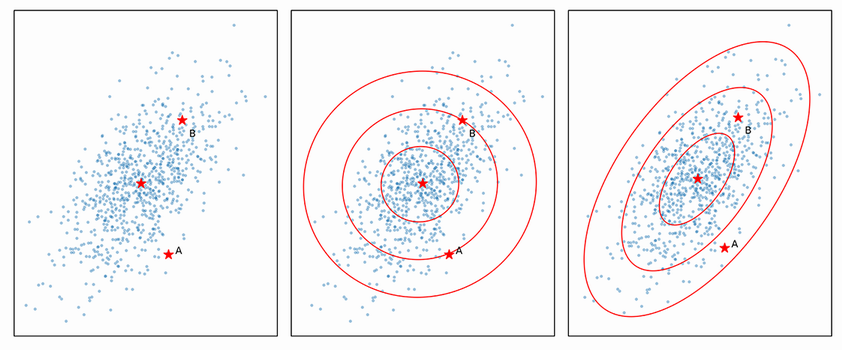
The figure contrasts equal Euclidean distances with distances measured against an ellipse fitted to the data. section 5.5
Estimate a robust covariance matrix
For three correlated numeric features, fit `sklearn.covariance.MinCovDet` to a data frame, then inspect `covariance_` for the estimated matrix and `location_` for the center. Call `mahalanobis(X)` to score distances from that fitted distribution. Robust estimation matters because outliers can distort a nonrobust covariance estimate, potentially masking outliers or flagging ordinary points. section 5.5.1
A single fitted matrix is most appropriate when the data forms one cluster and its dimensions are roughly Gaussian or at least unimodal. If distinct clusters have different centers and shapes, a Gaussian mixture model can estimate a covariance matrix for each cluster. PCA also uses a covariance matrix to transform correlated features, but it can be sensitive to outliers; clustering or segmenting first may help when correlations differ by region. section 5.5.1 section 5.6 section 6.9
Covariance matrices can also shape synthetic test data. After fitting a Gaussian mixture model, enlarging its clusters’ covariance matrices produces samples spread much farther than typical data. Such samples can provide candidate outliers for testing, rather than automatically establishing which generated records are meaningful anomalies. section 11.2.3




