liveBook · Manning

cProfile

As explained in Advanced Algorithms and Data Structures

cProfile is Python's deterministic profiler for recording execution-time statistics for function and method calls.

cProfile helps locate performance costs in Python programs by running a function and recording timing statistics for every involved method. A Huffman encoder provides a concrete target: profile repeated executions, then isolate heap-related functions instead of interpreting the entire report. section 2.10.1

The collected statistics support several levels of analysis:

  • Per-call time measures the cost associated with individual calls. section 2.10.1
  • Total and cumulative time expose costs across repeated calls and nested execution. section 2.10.1
  • pStats.Stats can print, process, or expose results as a dictionary, enabling filters for selected functions and CSV output. section 2.10.1

Profiling Huffman encoding

Profile huffman.create_encoding repeatedly, then examine _frequency_table_to_heap, _heap_to_tree, _heapify, top, and insert. Filtering these entries reduces report noise and supports more reliable comparisons. section 2.10.1
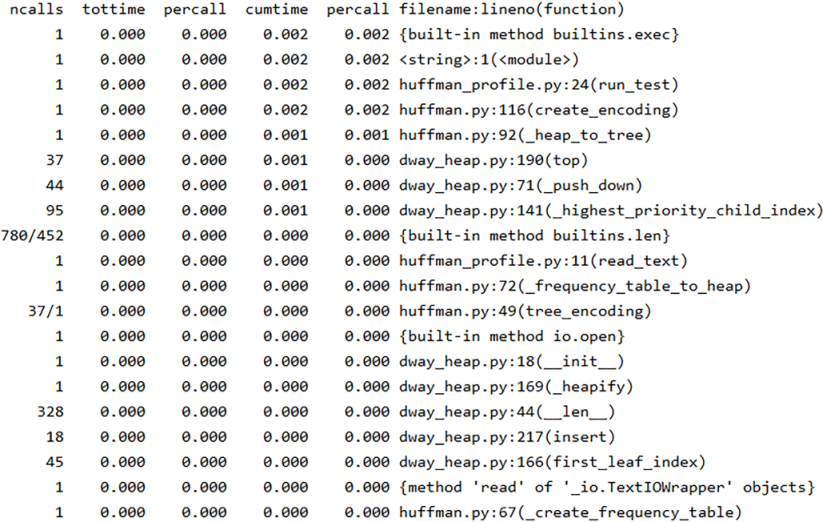
Figure 2.18 Printing Stats after profiling Huffman encoding function.

Use the profiling output figure to inspect the tabular shape of collected execution statistics. section 2.10.1


How Advanced Algorithms and Data Structures covers it

How deep it goes
Records per-call, total, and cumulative timings, then filters and exports results without detailing cProfile usage.
Examples
Uses repeated Huffman-encoding runs and selected heap-building and heap-operation functions as profiling targets.
What it assumes
Assumes Python familiarity and introduces cProfile as an included package, while deferring detailed usage instructions.
What you can do after
Diagnose/debug with cProfile by collecting, filtering, interpreting, and saving function timing statistics.
How it connects
Connects profiling with Huffman encoding, d-ary heaps, pStats.Stats, Pandas, Matplotlib, Jupyter Notebook, and CSV processing.

Also explained in

Compare how 2 books explain cProfile →

Related concepts

This explainer was generated by Manning's knowledge graph from the text of Advanced Algorithms and Data Structures. The section links point to the parts of the book it draws on.