A credible interval expresses uncertainty as a range rather than a single prediction. It contains a specified posterior probability for an uncertain quantity, making uncertainty visible when decisions involve risk. section 1.2.1 section 2.2.1
For a normal variable x, a (1 − α) interval contains x with probability 1 − α. A common 95% interval is μ ± 1.96σ, sometimes approximated as μ ± 2σ. section 2.2.1
Use credible intervals to read uncertainty and support decisions:
- Interpret wider intervals as greater predictive uncertainty when variances increase. section 2.2.1
- Use Gaussian-process intervals to quantify uncertainty around objective-function predictions in Bayesian optimization. section 1.2.1
- Balance potential reward against predictive risk instead of relying only on point estimates. section 1.2.1
Housing-price uncertainty
In a multivariate Gaussian model of three normalized house prices, error bars around the mean represent each variable’s 95% credible interval. The intervals grow from house A to B to C as their variances increase. section 2.2.1
Figure 2.5 Parallel coordinates plot visualizing a mean-normalized MVN from the housing price example. The error bars indicate 95% CIs of corresponding normal distributions, while the faded lines show samples drawn from the multivariate Gaussian.
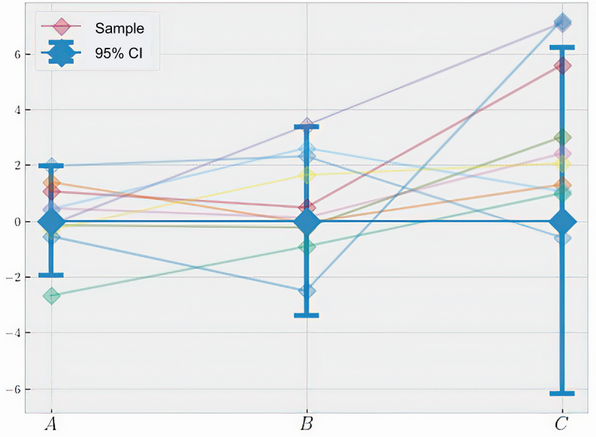
The parallel-coordinates visualization shows means, 95% credible-interval error bars, and sampled outcomes together. section 2.2.1
