A credible interval is a range containing a specified probability for a random variable. A 95% credible interval contains 95% of the distribution’s probability. For a normal distribution, it is approximately the mean plus or minus two standard deviations. section 3.12
The interval communicates uncertainty rather than only reporting a best estimate. A house-price slope with mean $100 and a large spread might have a 95% interval from −$100 to $300, expressing substantial uncertainty about the estimate. section 3.12
Credible intervals are used to:
- Show uncertainty around posterior predictive means with error bars. section 3.15
- Indicate that predictions become less certain where observed data are scarce. section 10.3
- Represent uncertainty from both the fitted model and observational noise in probabilistic predictions. section 3.15 section 10.3
House-price predictions
A probabilistic linear regression model produces a predictive mean for each test value and a corresponding 95% credible interval. Most observed points fall within the displayed intervals, while the posterior mean combines information from the data and the prior. section 3.15
Bayesian neural-network predictions
After MCMC samples the network parameters, predictions are shown as a mean curve with 95% credible intervals. The intervals cover much of the observed data and widen outside the training-data range. section 10.3
Figure 3.6 The posterior predictive distribution of individual datapoints in the test set, illustrated by the predictive mean and 95% credible intervals. Most datapoints in the training set falls within the credible intervals.
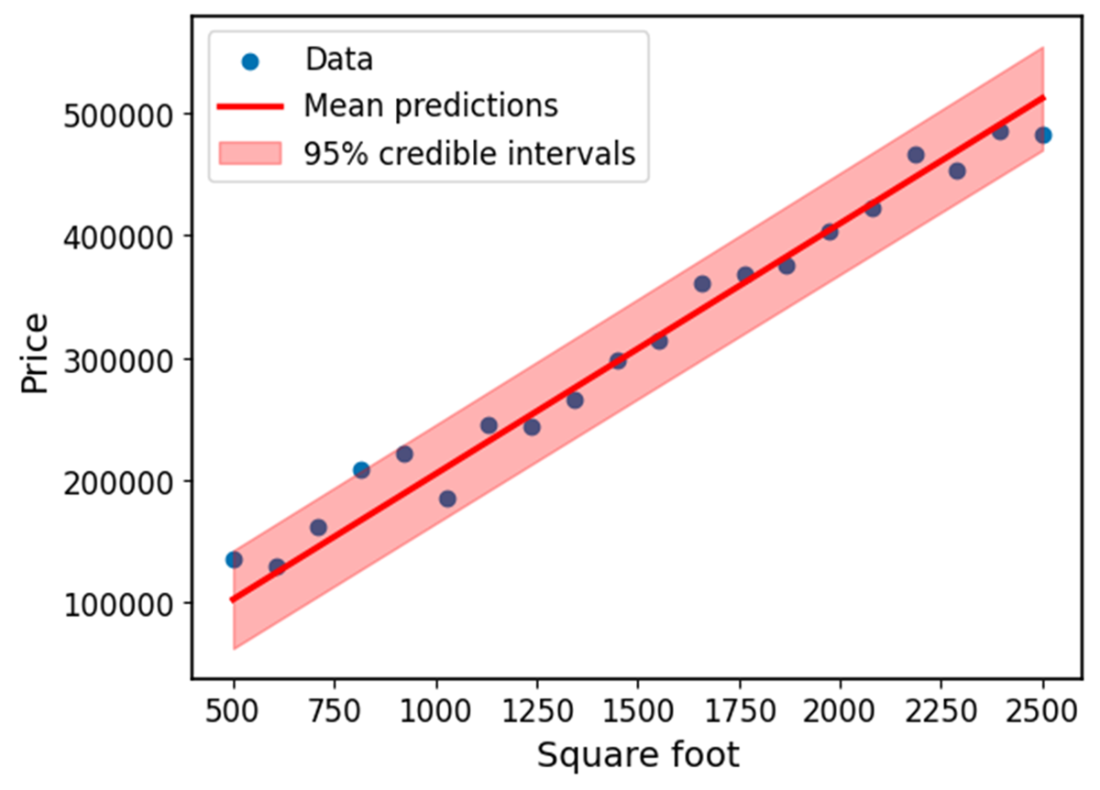
Visualizes predictive means and 95% credible intervals for individual test points. section 3.15