A critical region, or rejection region, is the set of test-statistic values that lead to rejection of the null hypothesis. It turns a statistical test into a decision rule: if the observed statistic falls in the region, reject the null; otherwise, fail to reject it. section 4.1.5
The significance level α specifies the maximum acceptable probability of a Type I error: rejecting the null hypothesis when it is true. The critical region translates that probability into values of the statistic using its sampling distribution under the null. In a two-tailed test at α = 0.05, the extreme 5% is divided equally between the two tails; a one-tailed test places the region on one side. section 4.1.5
Figure 4.1 Illustration of critical regions in a two-tailed hypothesis test at the 5% significance level. The curve represents the distribution of the test statistic under the null hypothesis. In a two-tailed test, the rejection regions are placed symmetrically in both extremes of the distribution, with 2.5% in each tail, so that results unusually far from the center in either direction would lead to rejecting the null. By contrast, a one-tailed test would place the entire 5% rejection region on only one side of the distribution, used when deviations are meaningful only in a single direction. This figure provides one example of how critical regions formalize the decision rule in hypothesis testing.
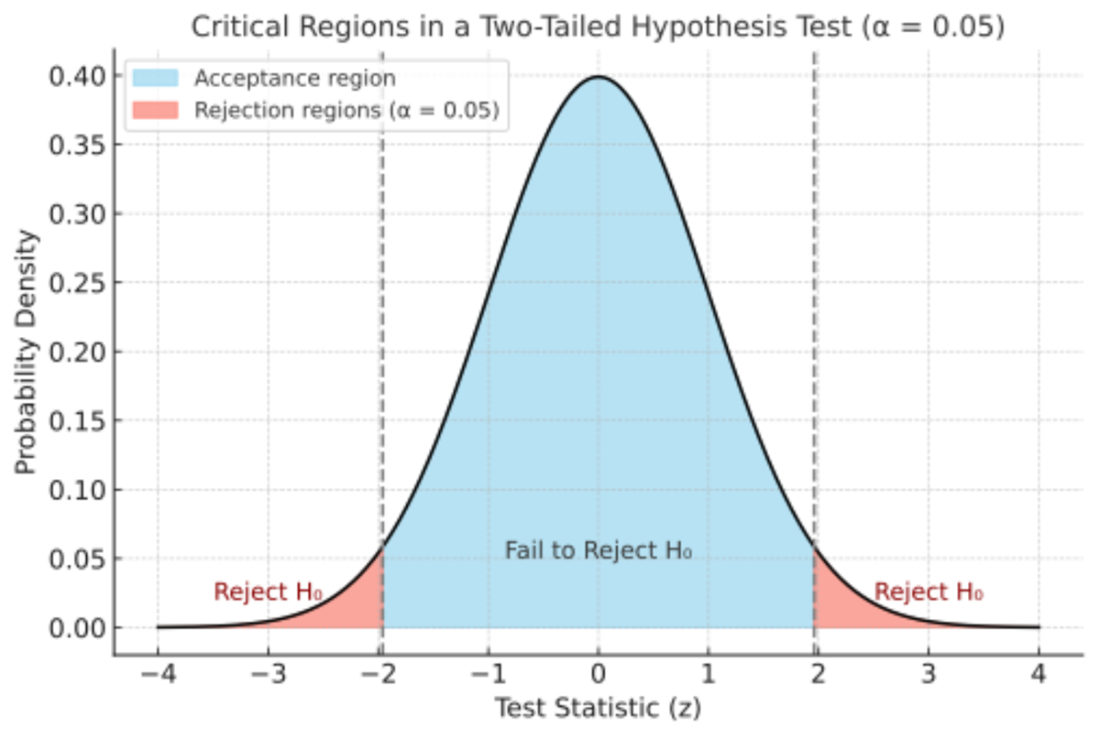
The figure shows a two-tailed critical region with 2.5% in each tail and contrasts it with a one-tailed rule. section 4.1.5
Critical values mark the boundaries of the region. The same decision can be expressed using a p-value: the probability, assuming the null hypothesis, of a statistic at least as extreme as the observed one. Reject when p ≤ α. Set the rule in advance so that the observed data do not determine the standard of evidence. section 4.1.5
Safety monitoring
For unusually high aircraft vibration, a one-tailed z-test uses α = 0.10 and an upper critical value of approximately 1.28. An observed z-score of 3.1 lies in the rejection region; its one-tailed p-value is approximately 0.001. The null hypothesis of normal operation is rejected, and the aircraft is removed from service for further inspection. The decision still carries a risk of a Type I error. section 4.2.2
A discrete threshold
In a trial of 20 patients with a null recovery probability of 50%, a one-tailed binomial test at α = 0.05 rejects for 15 or more recoveries. Fourteen recoveries fall short of that region, with p approximately 0.057. Failing to reject does not establish that the drug is ineffective or that the null hypothesis is true; it means the evidence did not meet the predetermined threshold. section 4.2.3
