liveBook · Manning

Cross-sectional data

As explained in Machine Learning for Tabular Data: XGBoost, Deep Learning, and AI

Cross-sectional data contains observations of multiple units measured at or around the same period rather than repeatedly through time.

Cross-sectional data records multiple units at or around the same period, often as tabular rows. Although observations share a time window, they may not be independent: relationships among units and group membership can transmit predictive information between features and targets. section 2.1.1

Analyze cross-sectional data with these safeguards:

  • Represent meaningful group membership explicitly. For company data, country, operations, and sector can capture relationships that would otherwise remain implicit. section 2.1.1
  • Keep related groups on only one side of each validation split when test-set group labels or relationships must not be shared with training data. section 2.1.1
  • Do not automatically treat rows as IID. Shared groups can create autocorrelation and inflate cross-validation estimates when prediction-time relationships differ. section 2.1.1
Figure 2.1 Comparison of IID and non--IID data sequences. The left chart shows IID data, while the right chart illustrates non-IID data, highlighting the sequential correlation patterns.
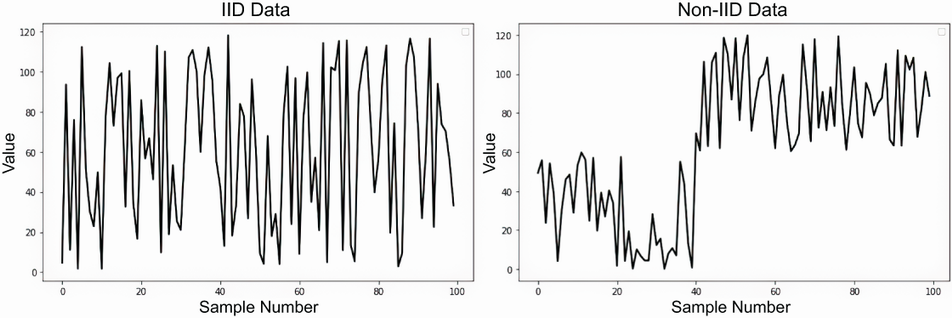
Compare IID and non-IID sequences to see why apparently similar rows can carry sequential or group-related dependencies. section 2.1.1


How Machine Learning for Tabular Data: XGBoost, Deep Learning, and AI covers it

How deep it goes
Explains non-IID dependencies, leakage, membership features, and grouped validation, but does not provide a complete implementation workflow.
Examples
Uses company country, operations, sector, and group-separated training and validation folds to illustrate dependency risks.
What it assumes
Assumes tabular rows and distinguishes multiple-unit observations from rows organized around repeated time intervals.
What you can do after
Diagnose leakage by encoding group relationships and separating related groups across validation folds.
How it connects
Connects cross-sectional data with IID data, time series analysis, feature engineering, leakage, autocorrelation, and cross-validation.

Also explained in

Compare how 2 books explain cross-sectional data →

Related concepts

This explainer was generated by Manning's knowledge graph from the text of Machine Learning for Tabular Data: XGBoost, Deep Learning, and AI. The section links point to the parts of the book it draws on.