The crossover error rate, also called the equal error rate (EER), is the operating point where false acceptance and false rejection rates are equal. It provides a balanced view of biometric or authentication accuracy: lower values indicate more reliable separation between legitimate and illegitimate activity. section 8.5 section 8.5.3
Interpret the metric alongside its two component errors:
- False rejection rate measures legitimate access attempts incorrectly rejected. section 8.5.4
- False acceptance rate measures unauthorized attempts incorrectly accepted. section 8.5.4
- EER identifies the threshold where both error rates match, helping teams balance security with user experience. section 8.5.3 section 8.8
DataSecure’s improvement
DataSecure recalibrated biometric sensitivity thresholds, added machine-learning improvements, and continuously reviewed real-time error data. Its EER fell from 2% to 0.35%, while false rejections fell from 3% to 0.5% and false acceptances from 1% to 0.2%. The result improved both authentication security and user experience. section 8.5.5
Figure 8.4 This graph illustrates the relationship between the false accept rate (FAR) and false reject rate (FRR) as a function of the threshold setting in a security system. The equal error rate (EER) is the point at which the FAR and FRR are equal, indicating the threshold where the probability of false acceptances is equal to the probability of false rejections.
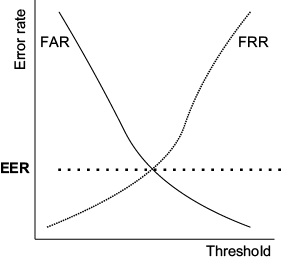
The graph shows FAR and FRR changing with the threshold; their intersection marks the equal error rate. section 8.5.3
