False rejection rate (FRR) measures how often a security system incorrectly denies legitimate access. In biometric authentication, a high FRR means authorized people may repeatedly be blocked from resources they need. It can also signal thresholds so strict that normal behavior generates unnecessary alerts. section 8.5.1
Track FRR alongside other authentication errors:
- Count false rejections by day, week, or month, and report a percentage so changes are easier to compare. section 8.5.4
- Check the false acceptance rate (FAR) before changing a threshold: reducing mistaken denials must not obscure mistaken approvals. section 8.5.3
- Use the equal error rate (EER), where FRR and FAR meet, as one measure when evaluating that balance. section 8.5.3
A biometric access dashboard
At a financial services company, employees and clients struggled to enter a biometric system while security staff also saw false acceptances. After reviewing error patterns, recalibrating sensitivity thresholds, and improving identification, false rejections fell from 150 to 30 per month; the reported FRR fell from 3% to 0.5%. The useful conclusion is not simply that access became easier: both kinds of error need continued monitoring. section 8.5.5
Figure 8.4 This graph illustrates the relationship between the false accept rate (FAR) and false reject rate (FRR) as a function of the threshold setting in a security system. The equal error rate (EER) is the point at which the FAR and FRR are equal, indicating the threshold where the probability of false acceptances is equal to the probability of false rejections.
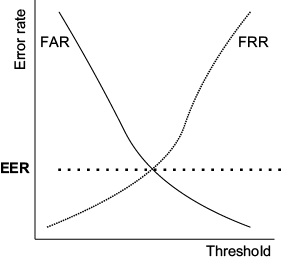
The threshold graph shows why FRR should be considered with FAR rather than minimized in isolation; their intersection marks EER. section 8.5.3
For an operational report, show the FRR trend, the corresponding FAR trend, and the effect on authorized users. Recommend threshold adjustments and further testing when mistaken denials disrupt access, then keep collecting both metrics to check that the change works. section 8.5.1 section 8.5.5