liveBook · Manning

Cyclical pattern

As explained in Starting Data Analytics with Generative AI and Python

Cyclicity is the recurrence of patterns or fluctuations at regular or approximately regular intervals.

A cyclical pattern is the recurrence of fluctuations at regular or approximately regular intervals. In time-series exploration, detecting cyclicity helps distinguish recurring behavior from one-off changes. section 2.6.2

Use cyclical-pattern checks to:

  • Visualize date-related variables over time before comparing business metrics across periods. section 2.6.2
  • Run cyclicity detection alongside outlier checks during the first exploratory data analysis iteration. section 2.6.2
  • Treat apparent fluctuations cautiously: changes may reflect operational growth, stabilization, collapse, or data-collection effects rather than a recurring cycle. section 2.6.2

Monthly review counts

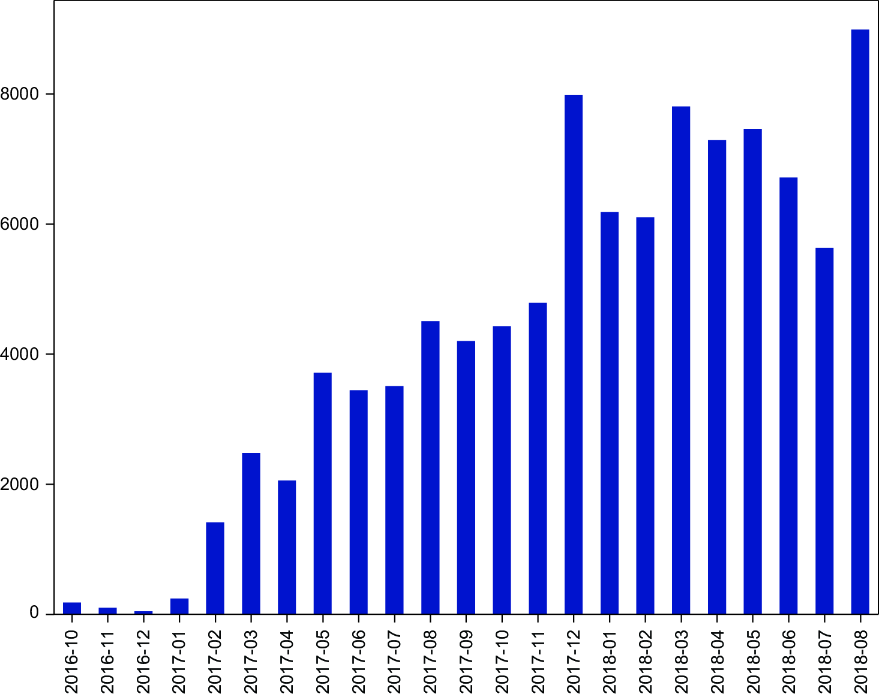
Monthly review counts show minimal activity, rapid growth, and later fluctuation or collapse and rebound. These phases make time-based comparisons informative, but they do not alone establish a regular cycle. section 2.6.2

Figure 2.3 The number of reviews over time—monthly aggregation
figure

Inspect the monthly review-count visualization to look for recurring fluctuations and distinguish them from broader trend changes. section 2.6.2

How Starting Data Analytics with Generative AI and Python covers it

How deep it goes
Defines recurrence and recommends detection, but stops short of explaining detection algorithms or confirming a specific cycle.
Examples
Illustrates changing monthly review volumes through minimal activity, rapid growth, stabilization, fluctuation, collapse, and rebound.
What it assumes
Assumes date-related variables and basic exploratory data analysis, while emphasizing repeated inspection rather than one-time analysis.
What you can do after
Evaluate time-based business changes by visualizing variables and checking whether fluctuations recur at approximately regular intervals.
How it connects
Connects cyclical patterns with time series, exploratory data analysis, outliers, data quality, and business-metric comparison.

This explainer was generated by Manning's knowledge graph from the text of Starting Data Analytics with Generative AI and Python. The section links point to the parts of the book it draws on.