A data application is an interactive tool whose interface and outputs are driven by data and computational code. Data-powered apps let analysts create custom interfaces for users to explore and manipulate data dynamically, especially when standard visualization tools cannot support complex inputs or logic. section 12.2.1 section 12.5
Data applications are useful when teams need to:
- Build interactive tools requiring complex user input or code that a data visualization tool cannot easily implement. section 12.2.1
- Rapidly prototype niche deliverables, gather stakeholder feedback, and refine the final product before investing heavily in development. section 12.2.1
- Combine data from multiple sources, present statistical or machine learning model outputs, and communicate technical information through an intuitive interface. section 12.5
Common implementation paths
R Shiny is the primary R ecosystem option for building interactive apps directly from R scripts. In Python, Streamlit is an open source framework designed to make data-powered app development accessible to data professionals. A Streamlit example predicts rat sightings through an interactive interface. section 12.2.1
Figure 12.4 An interactive data-powered app predicting rat sightings, created using Streamlit.
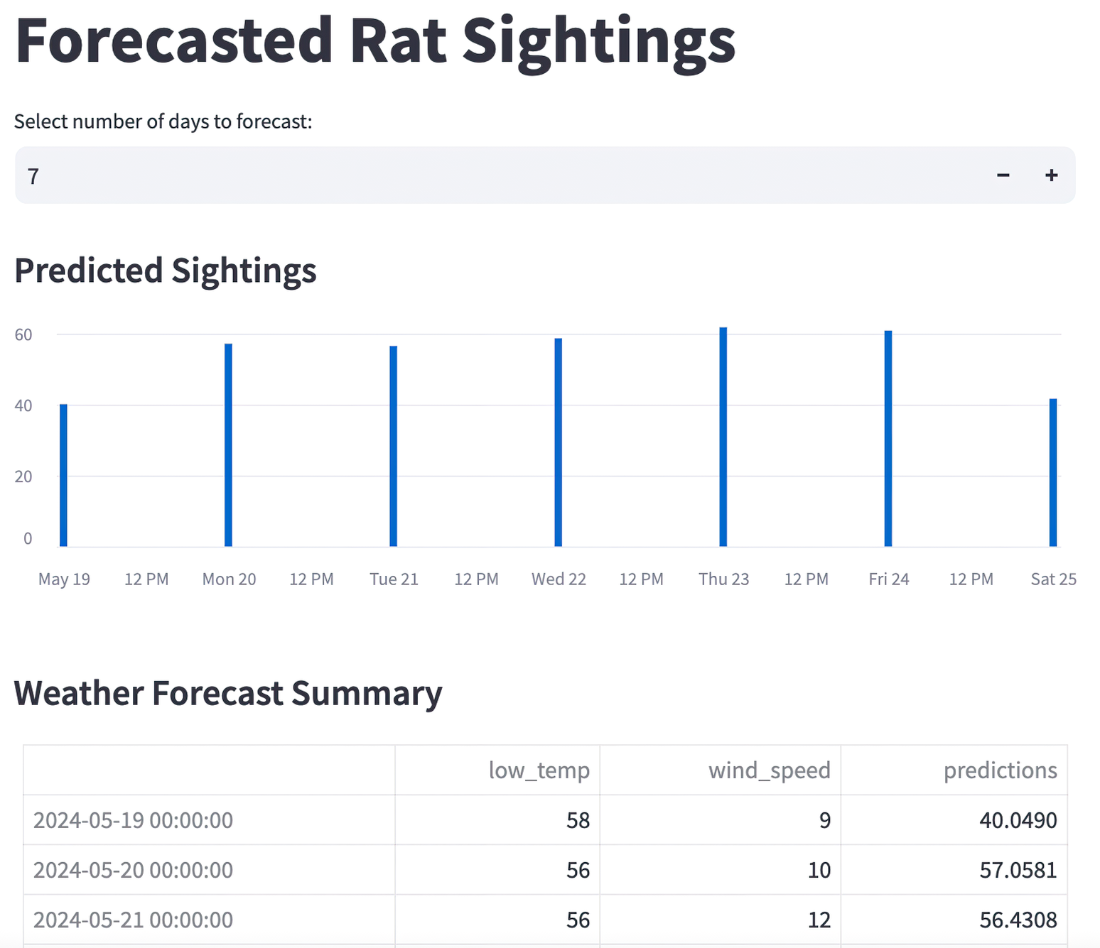
Use the interactive rat-sightings application as a concrete example of a data-powered app combining prediction with user interaction. section 12.2.1
