Dashboard
A dashboard is a visual interface that presents selected data, metrics, or status information in a consolidated view for monitoring, analysis, or decision-making.

Data-Driven Cybersecurity
A dashboard is an interactive or static visual interface that presents consolidated metrics and data for monitoring and decision-making.
- How it is used
- Turns security metrics into audience-specific views for monitoring posture and making operational or executive decisions.
- How deep it goes
- Develops metric selection, audience tailoring, chart choice, and interpretation through worked scenarios; does not specify a software implementation.
- Examples
- Contrasts executive and analyst dashboards for phishing, then uses before-and-after risk metrics to question unresolved exposure.
- What you can do after
- Build it from scratch by selecting stakeholder-specific metrics and visualizations, then interpret results against targets and remaining risks.
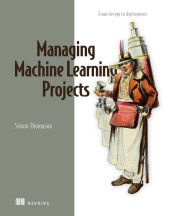
Delivering Machine Learning Projects: From design to deployment
A dashboard system is software that presents operational data and events through visual interfaces for users.
- How it is used
- Uses dashboards as assistive interfaces for inspecting business information and exploring model-informed outcomes.
- How deep it goes
- Defines dashboards and contrasts aggregate-based displays with model-driven predictions without detailing implementation code.
- Examples
- Illustrates inventory and customer churn dashboards for a bike-store project, including exploration of sales investment and competitor activity.
- What you can do after
- Evaluate dashboard designs for user needs and consider whether model outputs support the intended interface.
Read how Delivering Machine Learning Projects: From design to deployment explains dashboard →
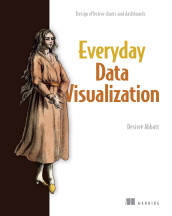
Everyday Data Visualization
A dashboard is a visual interface that combines multiple charts or other information displays to support monitoring or analysis.
- How it is used
- Brings related information together for tasks such as occupancy planning, metric monitoring, and exploratory comparison.
- How deep it goes
- Works through interactive views, user-led layout decisions, and a redesign rationale, without prescribing a software implementation.
- Examples
- Uses doctor survey results, a three-property hotel occupancy scenario, and an overview-to-detail metric wireframe.
- What you can do after
- Practice/perform user-led dashboard layout and evaluate whether overview, filtering, and details make information easier to find.

Machine Learning Platform Engineering
A dashboard is a visual interface that presents queried operational measurements and other status information.
- How it is used
- Visualizes operational and ML measurements so teams can monitor services, pipeline runs, and changes in incoming data.
- How deep it goes
- Shows metric exposure, scraping, querying, and charting, plus pipeline-driven dashboard updates; does not specify a general dashboard design procedure.
- Examples
- Uses a request-count time-series chart, an Evidently drift dashboard, Kubeflow pipeline metrics, and a Langfuse RAG observability view.
- What you can do after
- Apply it via Grafana to chart Prometheus metrics, or via Evidently to review drift results after inference pipeline runs.
Read how Machine Learning Platform Engineering explains dashboard →

Effective Platform Engineering
A dashboard is a visual interface that presents selected metrics, statuses, and trends for monitoring a system or objective.
- How it is used
- Supports observability by presenting correlated system, service, platform, and business information for monitoring and decision-making.
- How deep it goes
- Explains dashboard purpose, ownership, architecture, and code management, stopping short of detailed visualization implementation.
- Examples
- Uses single-pane observability views, service dashboards, standardized dashboards, and SLO dashboards with error-budget and burn-rate charts.
- What you can do after
- Operate/configure dashboards to monitor services, evaluate SLO performance, investigate incidents, and communicate system or business health.
Read how Effective Platform Engineering explains dashboard →

Learn Docker in a Month of Lunches, Second Edition
A dashboard is a visual display that organizes queried measurements into panels for monitoring a system or application.
- How it is used
- Supports container monitoring by turning Prometheus queries into visual panels for application oversight and operational response.
- How deep it goes
- Explains the Prometheus-to-Grafana workflow, panel queries, dashboard levels, and provisioning, while deferring application-specific metric design.
- Examples
- Uses an image gallery dashboard, HTTP error query, Compose load generation, and a to-do list dashboard lab.
- What you can do after
- Build it from scratch with Docker Compose, Prometheus, and Grafana, then provision panels for application metrics.
Read how Learn Docker in a Month of Lunches, Second Edition explains dashboard →

DuckDB in Action
A dashboard is an interface that presents selected data, summaries, or visualizations for monitoring or analysis.
- How it is used
- Presents business metrics as accessible, interactive charts for monitoring, analysis, and decision support.
- How deep it goes
- Explains the database-to-dataset-to-chart workflow and export process, but defers chart-design principles that could distort data meaning.
- Examples
- Uses an ATP dashboard with yearly match counts, Grand Slam winner trends, bar charts, and Big Number with Trendline.
- What you can do after
- Operate/configure Apache Superset to connect DuckDB, create datasets and charts, assemble dashboards, and export or import them.

Architecting an Apache Iceberg Lakehouse
A dashboard is a visual interface that combines charts and other summaries for monitoring or analyzing data.
- How it is used
- Deploys visual analytics for operational monitoring, historical analysis, embedded merchant experiences, and governed self-service access.
- How deep it goes
- Builds dashboards through dataset connection, chart configuration, arrangement, publication, and architecture tradeoffs, but stops short of BI internals.
- Examples
- Uses sales charts, merchant dashboards, logistics monitoring, and tenant-specific SaaS reporting interfaces.
- What you can do after
- Build it from scratch by connecting governed tables, defining charts, arranging views, publishing results, and applying access controls.
Read how Architecting an Apache Iceberg Lakehouse explains dashboard →

Think Like a Software Engineering Manager
A software dashboard is an interface that presents operational or performance information, often through metrics, visualizations, and status indicators.
- How it is used
- Supports operational visibility, incident response, deployment management, and postlaunch evaluation.
- How deep it goes
- Explains dashboards through their operational roles and outcomes, but does not detail their technical implementation.
- Examples
- Uses service-health views, deployment metric monitoring, and sales, ticketing, and customer-complaint dashboards.
- What you can do after
- Diagnose operational problems, monitor deployments, evaluate performance, and verify recovery against expected ranges.
Read how Think Like a Software Engineering Manager explains dashboard →

Cloud Observability in Action
A dashboard is a visual interface that presents selected measurements or status information for monitoring and analysis.
- How it is used
- Organizes related visualizations for monitoring, analysis, and alerting through connected data sources.
- How deep it goes
- Explains dashboard composition, data-source configuration, variables, and parameterized queries without descending into visualization internals.
- Examples
- Uses Grafana with Prometheus, Docker Compose, dashboard variables, and a parameterized HTTP-request-rate query.
- What you can do after
- Operate/configure Grafana dashboards with data sources, variables, panels, and PromQL queries.
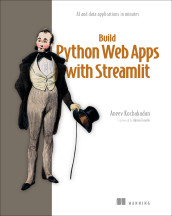
Build Python Web Apps with Streamlit
A dashboard is an interface that presents selected metrics or other information for monitoring and decision-making.
- How it is used
- Supports executive monitoring by presenting selected metrics, data cuts, and trends for informed decisions.
- How deep it goes
- Explains the dashboard pipeline from CSV loading through filtering, aggregation, widgets, and charts, while deferring detailed implementation code.
- Examples
- Uses an interactive sales dashboard with global filters, date selectors, metric cards, line charts, and pie-chart breakdowns.
- What you can do after
- Build it from scratch with Streamlit, pandas, and Plotly to load, transform, filter, and visualize business data.
Read how Build Python Web Apps with Streamlit explains dashboard →

Build Financial Software with Generative AI (From Scratch)
A dashboard is a user interface that presents information and supports interactions for monitoring or managing an application or process.
- How it is used
- Presents file, record, exception, and company information through an interface for operating ACH-processing workflows.
- How deep it goes
- Defines the dashboard role and demonstrates file-exception views and company-level information components.
- Examples
- Uses file and record views, exception drill-downs, and company components for batches, expected files, and limits.
- What you can do after
- Build it from scratch as an API-backed Next.js interface that lists companies and routes users to company dashboards.
Read how Build Financial Software with Generative AI (From Scratch) explains dashboard →

Effective Data Analysis
A dynamic dashboard updates or responds interactively to enable exploration of data and analysis results.
- How it is used
- Supports internal operational analytics by making metrics, insights, and recurring stakeholder questions easier to consume and investigate.
- How deep it goes
- Defines curated and interactive dashboards, then extends into layout, filters, labeling, instructions, publication, and feedback.
- Examples
- Uses a support KPI against an SLA threshold and an e-commerce website-engagement dashboard with charts and interactive filters.
- What you can do after
- Builds and publishes self-service dashboards with Tableau, Hex, Deepnote, Streamlit, or comparable visualization tools.

ScyllaDB in Action
A dashboard is a visual interface that organizes monitoring data into panels for observing system behavior and performance.
- How it is used
- Supports monitoring ScyllaDB by organizing Prometheus metrics into visual views of cluster performance and activity.
- How deep it goes
- Explains dashboard purposes, deployment dependencies, and load-test interpretation, but defers detailed panel construction and query authoring.
- Examples
- Uses Overview and Scylla CQL dashboards, query graphs, cassandra-stress results, and generated monitoring-stack dashboards.
- What you can do after
- Operate/configure Grafana dashboards to observe query traffic, latency, availability, and load-test effects.
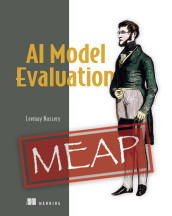
AI Model Evaluation
A dashboard is an interactive interface that presents selected data, metrics, and trends for monitoring or analysis.
- How it is used
- Supports model evaluation by exposing metric trade-offs, threshold violations, and changes that require product or engineering decisions.
- How deep it goes
- Explains dashboard contents and monitoring logic, but stops short of specifying implementation architecture or visualization software.
- Examples
- Uses baseline-versus-new-model comparisons, CTR, retention, PSI, rolling aggregates, and LLM-as-a-judge scores.
- What you can do after
- Diagnose metric trade-offs and drift by comparing models, baselines, thresholds, and time-series behavior.

AI for Everyday IT
A dashboard is an interactive or formatted interface that presents key information, metrics, and status indicators for monitoring and decision-making.
- How it is used
- Tracks PIP objectives and progress to support employee improvement and manager follow-up.
- How deep it goes
- Specifies dashboard fields and visualizations, then notes that generated templates may need added calculations.
- Examples
- Uses an Excel tracker for a senior Database Administrator, with KPI bar graphs, milestones, deadlines, and status.
- What you can do after
- Build a reusable Excel PIP-tracking template with ChatGPT, then tailor its calculations and content.
Fast by Default
A software interface that presents operational measurements and system status for ongoing observation.
- How it is used
- Uses dashboards to observe operational behavior and expose performance problems through user interactions, system paths, and outcome metrics.
- How deep it goes
- Traces filtering across four system paths and identifies implementation failures, then stops at measurement, fixing, ownership, and maintenance practices.
- Examples
- Uses a cross-platform dashboard whose filters fetch data and re-render three chart panels.
- What you can do after
- Diagnose/debug with it by tracing delayed interactions across user, data, execution, and result paths.
Also covered in
- MongoDB 8.0 in Action, Third Edition
- Build High Value Software SystemsIn early access (MEAP)
- Logs and Telemetry
- Platform Engineering on Kubernetes
- Spring AI in Action
- First-Party Data Activation
- Think Like a CTO
- Digital Twins in Action
- Event Processing in Action
- D3.js in Action, Third Edition
- Data Pipelines with Apache Airflow, Second Edition
- gRPC Microservices in Go
What to know first
- performancePerformance is a measure of how effectively a person, process, model, or system achieves its objectives, including qualities such as output quality, speed, and resource efficiency.
- metricA metric is a quantitative measure that assigns values to a property or outcome so it can be assessed, compared, or monitored.
- alertingAlerting is the generation and delivery of notifications when monitored conditions or events meet defined criteria or require attention or action.
- language modelA language model is a computational model that represents patterns in linguistic sequences to assign probabilities, predict, generate, or evaluate language.
Related concepts
- performanceuses · Performance is a measure of how effectively a person, process, model, or system achieves its objectives, including qualities such as output quality, speed, and resource efficiency.
- metricuses · A metric is a quantitative measure that assigns values to a property or outcome so it can be assessed, compared, or monitored.
- key performance indicatoruses · A key performance indicator is a selected measurable value used to assess performance or progress toward an important objective.
- Grafanaused by · Grafana is an open-source observability and visualization platform for querying, exploring, and displaying data from diverse sources and configuring alerts.
- visualizationhas part · Visualization is the representation of data, information, or concepts in visual form to support inspection, interpretation, analysis, or communication.
- alertinguses · Alerting is the generation and delivery of notifications when monitored conditions or events meet defined criteria or require attention or action.
Questions about dashboard
What is dashboard?
A dashboard is a visual interface that presents selected data, metrics, or status information in a consolidated view for monitoring, analysis, or decision-making.
Which Manning books explain dashboard?
Data-Driven Cybersecurity, Delivering Machine Learning Projects: From design to deployment, Everyday Data Visualization, Machine Learning Platform Engineering, Effective Platform Engineering, Learn Docker in a Month of Lunches, Second Edition, DuckDB in Action, Architecting an Apache Iceberg Lakehouse and 9 more.
What should I know before learning dashboard?
Manning books that teach dashboard usually introduce performance, metric, alerting and language model first.
What are the parts of dashboard?
Dashboard includes visualization.
These guides are generated from the text of Manning books by Manning's knowledge graph and link to the sections they draw on. The full books are available on liveBook and at manning.com.