A dashboard brings selected metrics into one interactive view so teams can compare model changes, apply agreed thresholds, and make trade-offs visible. In evaluation workflows, it connects measurement to product decisions rather than treating any single score as sufficient. section 2.3.2
A useful evaluation dashboard should make several relationships easy to inspect:
- Compare baseline and new-model performance side by side. section 2.3.2
- Show whether metric changes are positive, negative, or outside acceptable thresholds. section 2.3.2
- Keep guardrails visible alongside optimization metrics, including safety, privacy, fairness, latency, and policy compliance. section 2.3.2
- Track rolling metrics against control baselines to reveal data drift or metric drift during retraining. section 8.7.2
Model evaluation and drift monitoring
A recommendation system dashboard can compare a baseline with a new model across relevance, safety, latency, CTR, and retention. A second view can plot CTR over time beside retention and PSI: stable movement suggests ordinary variance, while unexplained trends or rising PSI warrant investigation. If an LLM judge supplies scores, its version and rubric should be monitored so judge changes are not mistaken for product drift. section 2.3.2 section 8.7.2
Figure 2.5 illustrates a dashboard that displays multiple metrics simultaneously, enablings engineers to see how changes to a model affect different performance aspects at once. Key features include side-by-side comparisons between baseline and new model performance and visual indicators showing whether changes are positive or negative, based on acceptable thresholds to avoid interpretation errors.
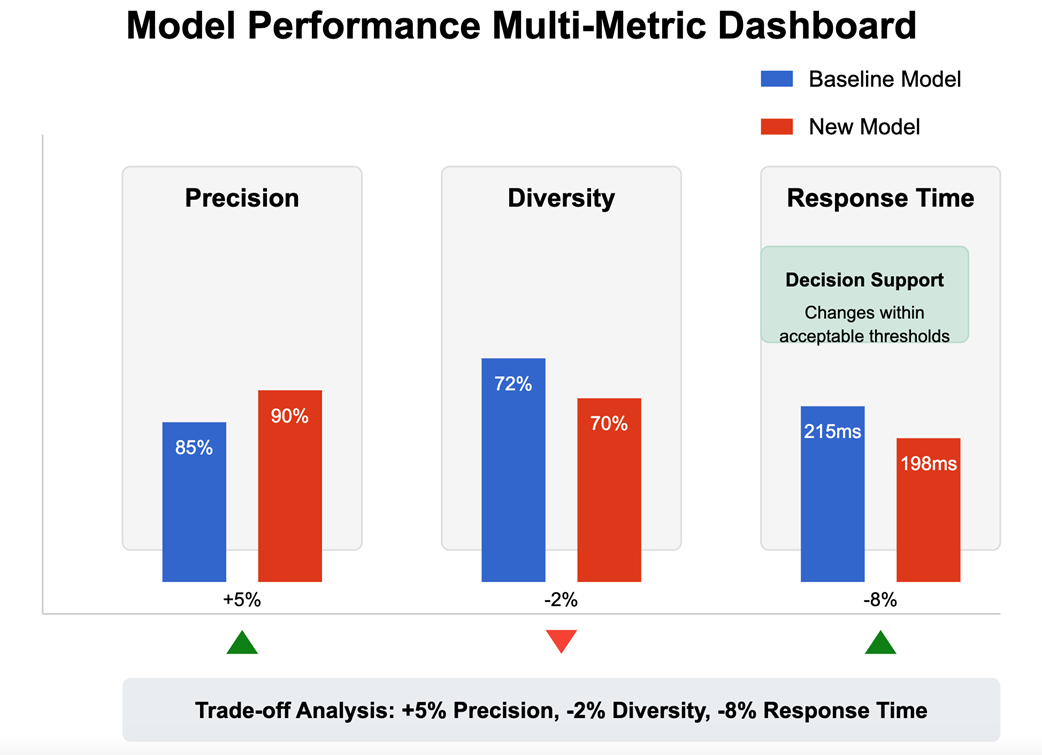
Inspect a multi-metric dashboard with baseline comparisons and visual threshold signals for interpreting model changes. section 2.3.2
Figure 8.5 illustrates a metric drift dashboard mock-up. The left panel shows CTR over time where the stable series fluctuates within normal variance, while the drifting series trends upward beyond the baseline, suggesting feedback-driven distortion. The right panel tracks retention and PSI (Population Stability Index).
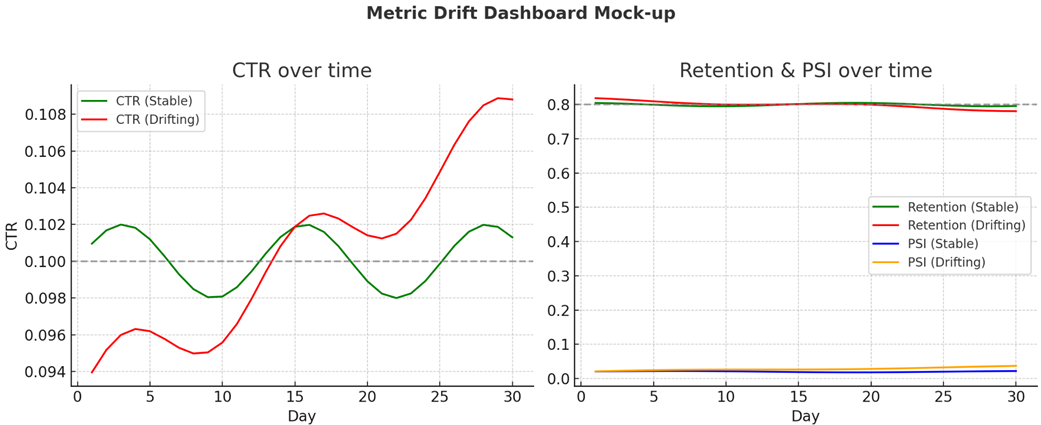
Inspect a drift dashboard that contrasts stable and distorted CTR trends with retention and PSI. section 8.7.2