A dashboard presents measurements and system status for ongoing observation. As dashboards grow, small delays can accumulate into slow panels, hesitant charts, inconsistent filtering, backend resource spikes, mobile memory pressure, and lower task completion. section 1.4
A filter interaction crosses four system paths: the user selects an option, data is fetched and synchronized, charts and state re-render, and the filtered result appears. Sequential requests, missing caching, unnecessary re-renders, heavy libraries, and premature incomplete rendering compound the delay. section 1.4
Keep dashboard performance from degrading by:
- Measuring real usage before changing implementation, including load times on representative devices and backend resource behavior. section 1.4
- Building fixes around root causes, such as caching repeated computations, parallelizing data requests, and reducing unnecessary re-renders. section 1.4
- Owning performance through visible checks in CI and code reviews, then maintaining gains with regular reviews and monitoring. section 1.4
Figure 1.4 An example dashboard application. Filter controls at the top trigger data fetches and re-renders across three chart panels. Clicking "Apply filters" touches every System Path: the user acts, data is fetched, charts re-render, and results appear.
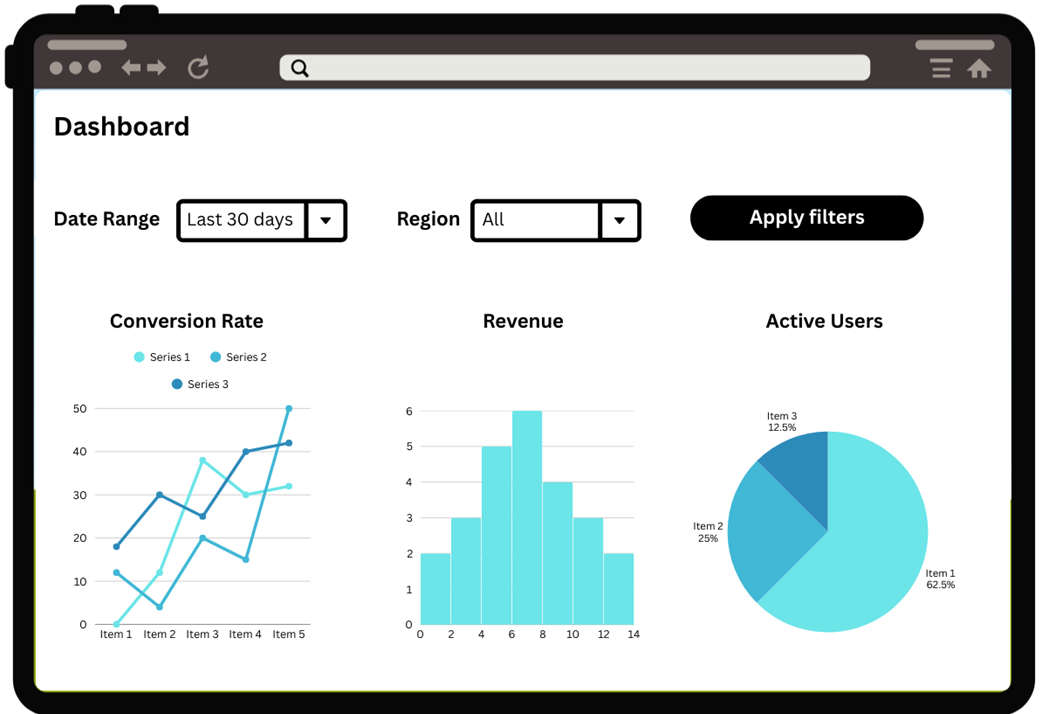
Trace how applying filters moves through user action, data access, execution, and displayed results. section 1.4