DGraphDTA is a dual-graph neural model for predicting drug-target affinity: how strongly a drug molecule binds to a protein target. Unlike GraphDTA, which pairs a drug graph with a protein sequence encoder, it represents both partners as graphs. DualGraphDTA is a teaching implementation inspired by this design. section 11.0
A molecular graph makes atom connectivity explicit. A protein graph uses amino acid residues as nodes and spatial contacts as edges: for example, two residues can be connected when their alpha-carbons are within 8 Å. Protein node features can combine biochemical properties with evolutionary information from a position-specific scoring matrix (PSSM). section 11.1.2 section 11.3 section 11.3.2
Figure 11.1 Architecture of a Dual-Graph Model for Drug-Target Affinity Prediction. In section 11.1, we’ll familiarize ourselves with the problem of drug-target affinity prediction so we can better understand our objective for this chapter, why we need to work with both molecule and protein data inputs, why graph neural networks offer an advantageous approach over alternatives, and what benchmarks we’ll be using to guide model development. Section 11.2 and 11.3 detail how we can transform textual representations of molecules and proteins into rich, graph-based representations. In section 11.4, we’ll introduce the core learning engine, graph neural networks, that facilitate learning on graphs. Section 11.5 combines the previous sections to show the full DGraphDTA dual-stream architecture implementation, which we’ll train and later evaluate in section 11.6. The illustrated inputs (SMILES, protein sequence, experimental data) are based on a real result from [3] concerning development of a series of p38α inhibitors for rheumatoid arthritis.
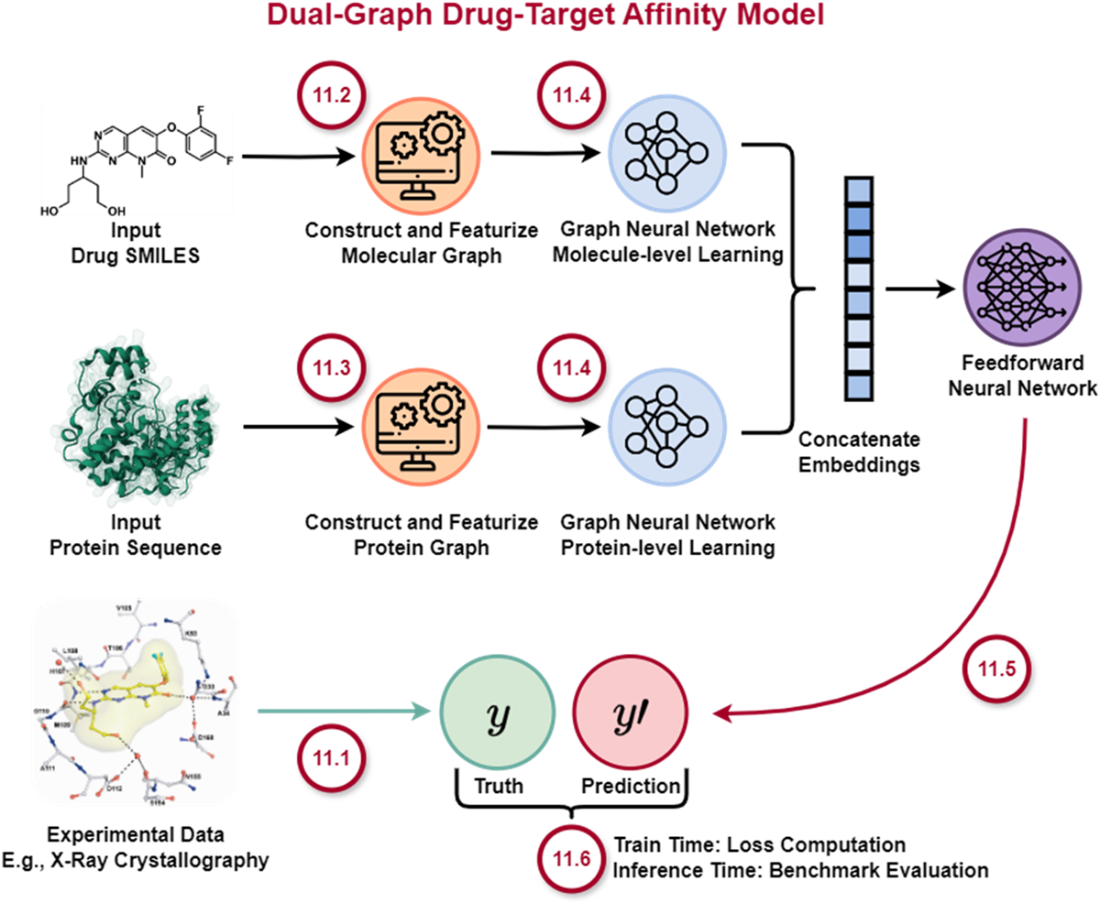
Follow the drug and protein inputs through the dual-graph prediction architecture. section 11.0
The prediction pipeline has four main stages:
- Encode the drug and protein graphs separately with graph neural network layers, allowing each stream to learn features suited to its input. section 11.5.1
- Pool the node representations in each stream into a fixed-size graph embedding. section 11.5.1
- Concatenate the drug and protein embeddings to represent the pair. section 11.5.1
- Pass the combined vector through a multilayer perceptron to predict one binding-affinity value. section 11.5.1
In the GCN implementation, the molecular stream uses three graph convolution layers, global mean pooling, and fully connected layers. The pooling operation uses a batch vector to produce a separate representation for each molecule in a mini-batch. The protein stream follows a similar pattern. section 11.5.2
Listing 11.7 Process Molecular Graph through GCN Layers
def forward_mol(self, data_mol):
    mol_x, mol_edge_index, mol_batch = \
        data_mol.x, data_mol.edge_index, data_mol.batch

    x = self.relu(self.mol_conv1(mol_x, mol_edge_index))
    x = self.relu(self.mol_conv2(x, mol_edge_index))
    x = self.relu(self.mol_conv3(x, mol_edge_index))

    x = global_mean_pool(x, mol_batch)

    x = self.relu(self.mol_fc_g1(x))
    x = self.dropout(x)
    x = self.mol_fc_g2(x)
    x = self.dropout(x)
    return x
Inspect the molecular forward pass, from graph convolutions through pooling and projection. section 11.5.2
Protein contacts can be obtained from experimental or predicted structures, or from predicted contact maps. This adds spatial information but creates a data-availability trade-off: unlike a sequence-only protein encoder, the graph pipeline needs structural or contact information. Computing PSSM features can also make evaluation demanding. section 11.3 section 11.6.2
Benchmark evaluation
For the reported dual-GCN DGraphDTA results, mean squared error was 0.202 on DAVIS and 0.126 on KIBA; Pearson correlations were 0.867 and 0.903, respectively. DAVIS uses pKd, while KIBA uses a different score, so the error values require dataset-specific interpretation. section 11.6.2
