liveBook · Manning

Diagnostic plot

As explained in Machine Learning System Design

A diagnostic plot is a statistical visualization designed to reveal violations of model assumptions, influential observations, or other systematic patterns in model results.

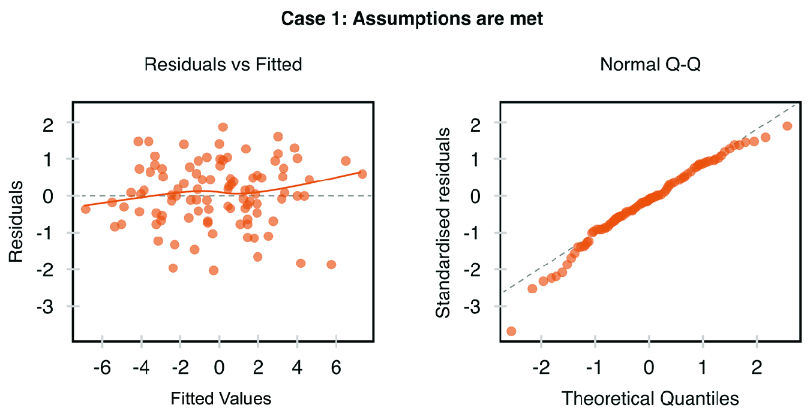
A diagnostic plot checks whether a fitted regression behaves as its assumptions require. It can expose nonlinear relationships, biased residuals, changing variance, and influential observations before they distort conclusions. section 9.2.2

Use four complementary views of the residuals:

  • Residuals versus fitted values: look for a pattern-free horizontal band to support a linear relationship. section 9.2.2
  • Normal Q-Q plot: compare standardized-residual quantiles with the standard normal distribution; points near the line support normality. section 9.2.2
  • Scale-location plot: check whether residual spread stays even across fitted values; widening spread indicates heteroscedasticity. section 9.2.2
  • Residuals versus leverage: locate observations that could substantially change coefficients; Cook’s Distance helps measure influence. section 9.2.2
Figure 9.10 Four diagnostic plots for linear regression’s residual analysis in both cases (Case 1: Assumptions are met)
figure

Compare the four plots when regression assumptions are met with the corresponding failure patterns shown in the paired case. section 9.2.2


How Machine Learning System Design covers it

How deep it goes
Explains four residual plots and their visual signals, but stops short of remediation procedures.
Examples
Uses paired regression cases, including a scale-location plot showing higher variance at higher fitted values.
What it assumes
Assumes a fitted regression model and residuals, while defining the four assumption checks from those outputs.
What you can do after
Diagnose regression-assumption violations and identify observations that may influence fitted coefficients.
How it connects
Connects residuals with linearity, normality, homoscedasticity, leverage, influential observations, and Cook’s Distance.

Also explained in

Compare how 2 books explain diagnostic plot →

Related concepts

This explainer was generated by Manning's knowledge graph from the text of Machine Learning System Design. The section links point to the parts of the book it draws on.