The dissociation constant (Kd or KD) measures how tightly a ligand binds its target. Lower values mean stronger binding. For kinetic measurements, KD equals koff divided by kon and is reported in molar units. section 6.1.3 section 11.1.1
Use Kd as an experimentally grounded target in a drug-discovery workflow:
- Measure binding with surface plasmon resonance (SPR): inject ligand over immobilized target, derive kon during association, and derive koff during dissociation. section 6.1.3
- Convert raw Kd values reported in nanomolar units to pKd, using pKd = -log10(Kd), so higher values represent stronger affinity and large ranges become easier to model. section 11.1.1 section 11.6.2
- Treat assay limits carefully: the DAVIS value of pKd 5 aggregates interactions measured at 10,000 nM or greater, rather than representing one common biological affinity. section 11.1.1
- Evaluate predicted pKd with error and ranking metrics: MSE measures numerical accuracy, while Pearson correlation and concordance support relative-affinity prioritization. section 11.6.2
Interpreting a prediction error
An RMSE of 0.45 pKd units corresponds to about a 2.8-fold typical error in Kd, because one pKd unit represents a tenfold change in dissociation constant. Such predictions can distinguish high-affinity binders from weak binders and help rank compounds for virtual screening. section 11.6.2
Figure 6.4 Surface plasmon resonance (SPR) plot of response signal to time, and how changes in the angle of the reflected light correspond to the underlying biomolecule binding events that are taking place at the surface layer, between the immobilized target and the flow of solution containing the ligand of interest.
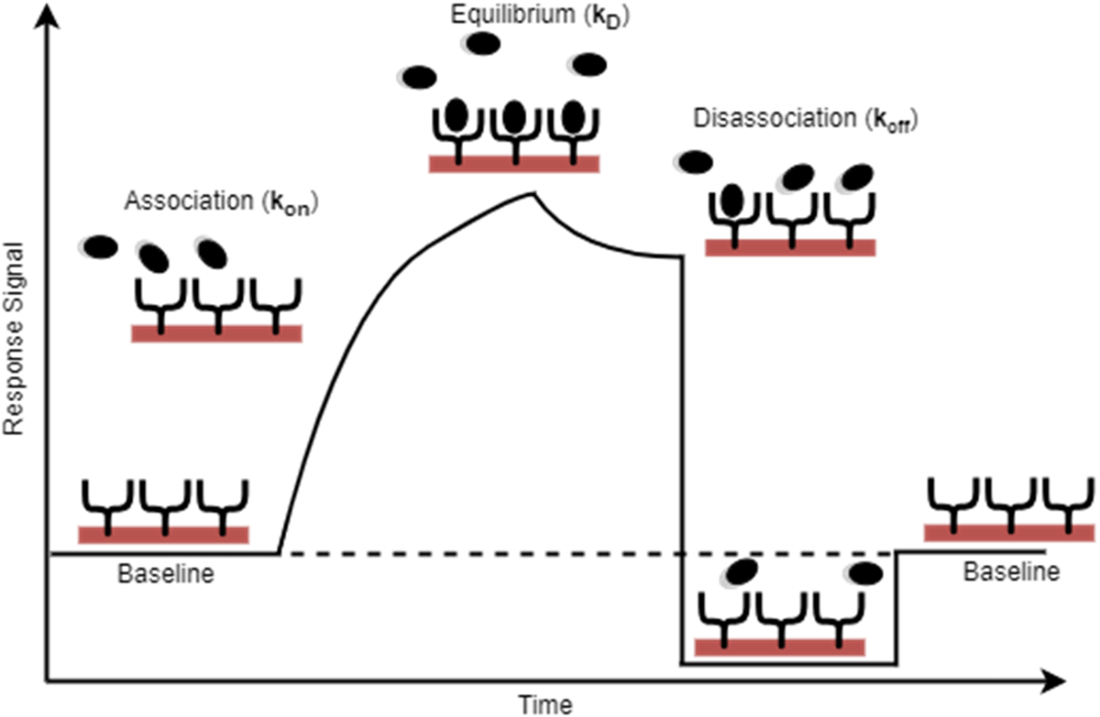
Inspect the SPR response curve to connect association and dissociation phases with the kinetic quantities used to calculate KD. section 6.1.3
