pKd expresses drug–target binding affinity on a logarithmic scale: pKd = −log10(Kd in molar units). Kd is the experimentally derived dissociation constant; a lower Kd means stronger binding, so a higher pKd means stronger affinity. The logarithmic conversion also compresses a wide range of values for model training. section 11.1.1 section 11.5.5
Converting a DAVIS measurement
A Kd of 10,000 nM is 0.00001 M, giving pKd 5. A one-unit increase in pKd corresponds to a tenfold decrease in Kd: pKd 6 corresponds to 1,000 nM and stronger binding. section 11.1.1 section 11.6.2
In DAVIS, interactions measured at 10,000 nM or greater were treated as non-significant and represented by pKd 5. The resulting spike aggregates weak and non-binding pairs rather than indicating a common precise affinity. A model that mostly predicts 5 can therefore achieve deceptively low mean squared error while learning little about stronger binders. section 11.1.1
Figure 11.2 Distribution of pKd Affinity Values in the DAVIS Dataset and KIBA scores in the KIBA Dataset. For the DAVIS dataset, we observe a very large, sharp peak visible at the y-value of 5, with a much smaller, broader distribution of values between 6 and 10.
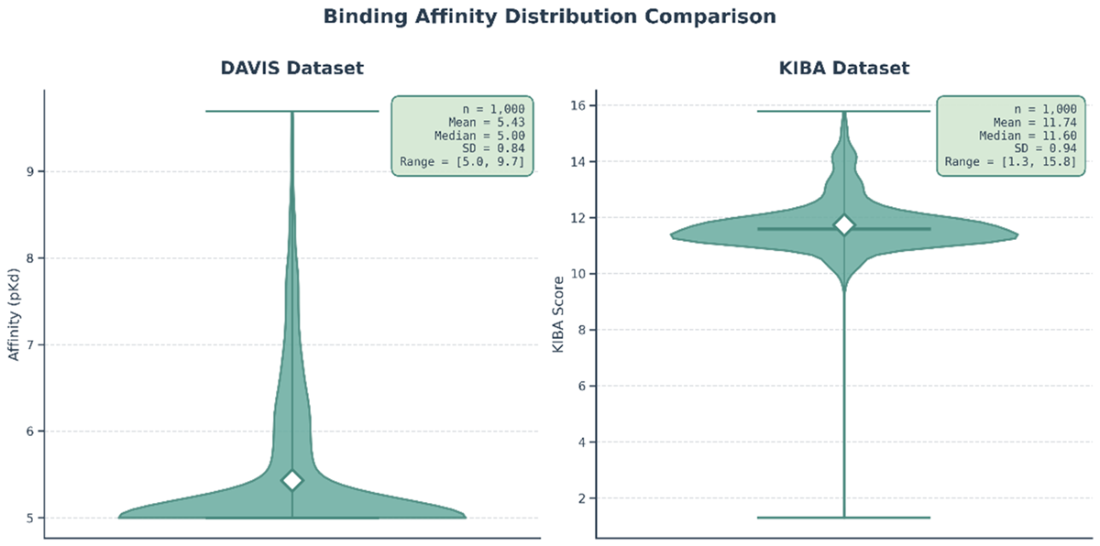
Compare the large DAVIS peak at pKd 5 with its smaller distribution at higher affinities. KIBA uses a different score, not pKd. section 11.1.1 section 11.6.2
For predictions in pKd units, an MSE of about 0.2 gives an RMSE of about 0.45 pKd units. On the Kd scale, a 0.45-unit difference corresponds to roughly a 2.8-fold difference. Pearson correlation complements error metrics by measuring the linear relationship between predictions and measurements, but it can remain high even when predictions are systematically biased. section 11.6.2
Evaluation splits also affect interpretation. A warm-start test can contain compounds and proteins seen during training, though not in the same pairs. Cold-start splits hold out drugs, targets, or both, testing generalization to unseen partners more strictly. section 11.5.5
