liveBook · Manning

Distributed tracing system

As explained in Microservices Patterns, Second Edition

Distributed tracing is the recording and analysis of request execution across multiple distributed software components.

Distributed tracing assigns a unique ID to each external request and follows it across services. It helps diagnose request handling and latency when a request passes through multiple services and no single log shows the whole path. section 7.6.2

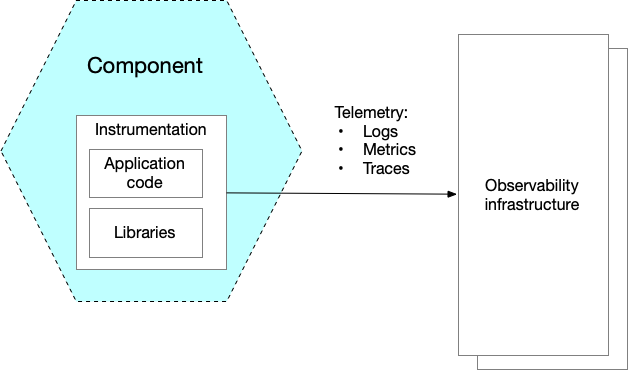
Tracing depends on coordinated instrumentation and telemetry infrastructure:

  • Developers instrument components to emit telemetry. section 5.6.2
  • Operations provide infrastructure services that collect, store, and analyze telemetry. section 5.6.2
Figure 5.20 Observability requires collaboration between developers and operations. Developers create services that are instrumented to emit telemetry. Operations provide the infrastructure services that collect, store and analyze the telemetry.
about observability

Shows how developer instrumentation and operations infrastructure work together to provide observability. section 5.6.2

How Microservices Patterns, Second Edition covers it

How deep it goes
Defines unique request IDs and cross-service tracing, while leaving implementation details unspecified.
What you can do after
Diagnose request-handling and latency problems by following a request across multiple services.
How it connects
Links distributed tracing to observability alongside log aggregation, health check APIs, exception tracking, and application metrics.

Related concepts

This explainer was generated by Manning's knowledge graph from the text of Microservices Patterns, Second Edition. The section links point to the parts of the book it draws on.