Observability patterns make application behavior easier to understand and troubleshoot. They collect telemetry—such as logs, metrics, and traces—for diagnosing issues, understanding dependencies, and assessing reliability; telemetry can also reveal whether users use valued features. section 5.6.2
Each pattern combines instrumentation within application components, which gathers and emits telemetry, with infrastructure services that collect, store, and analyze it. Developers implement the instrumentation; operations provide and manage the infrastructure. Some instrumentation uses libraries, while domain-specific metrics and application-level logging may require application code. section 5.6.2
Figure 5.20 Observability requires collaboration between developers and operations. Developers create services that are instrumented to emit telemetry. Operations provide the infrastructure services that collect, store and analyze the telemetry.
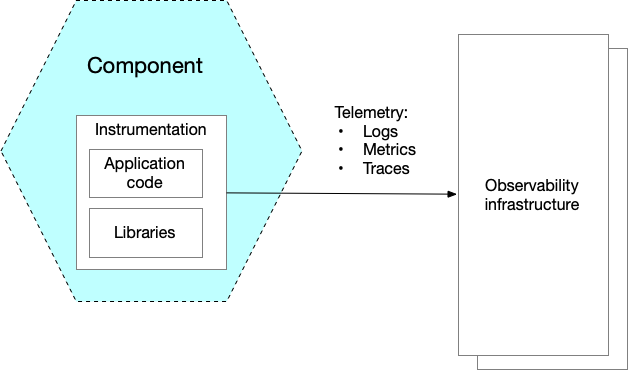
The figure shows how instrumented services and operations-provided telemetry infrastructure work together. section 5.6.2
These patterns are especially important in microservices: a request may cross several services, so there is no single log file to inspect and latency can have multiple possible causes. section 7.6.2
Common patterns include:
- Log aggregation centralizes logs for searching and alerting. section 5.6.2 section 7.6.2
- Distributed tracing assigns a unique ID to each external request and follows it across services. section 5.6.2 section 7.6.2
- Application metrics capture measures such as resource utilization; health check APIs expose service health, and exception tracking reports exceptions to a tracking service. section 5.6.2 section 7.6.2