Distribution testing examines observed values and frequencies to determine whether they follow expected patterns. It can expose data-entry errors, bias, or other issues that threaten analytical validity, while informing the choice of statistical tests, predictive models, and data transformations. section 2.6.1
Treat the data like a multidimensional coin: repeated outcomes may look plausible while still failing to behave as expected. Compare the observed distribution with a theoretical distribution such as normal, exponential, or binomial, without assuming that an apparent pattern is correct. section 2.6.1
A practical review can combine:
- Visual checks using histograms, box plots, density plots, or Q-Q plots. section 2.6.1
- Quantitative tests such as Kolmogorov-Smirnov, Shapiro-Wilk for normality, or Anderson-Darling. section 2.6.1
- Basic descriptive characteristics, including mean, standard deviation, and range, as part of exploratory data analysis. section 2.4.2
A first question
Ask an AI assistant: “How can I test what distribution does my dataset fit best?” Add the analytical environment, data source, or intuition being examined when a more specific answer is needed. Inspect the suggested method and validate its assumptions rather than treating the response as confirmation. section 2.6.1
Figure 2.2 Commonly encountered data distributions
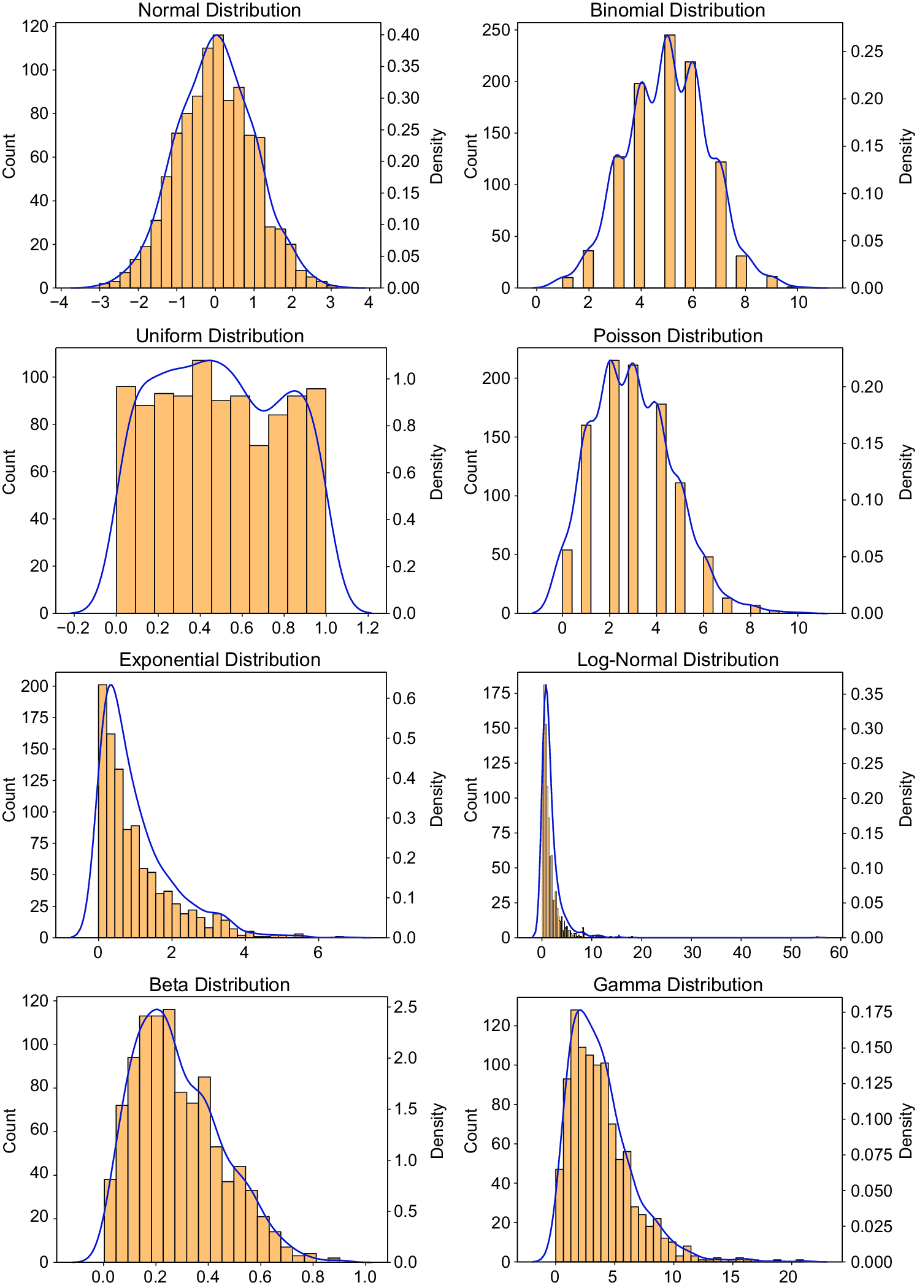
Use the distribution overview to compare common shapes before selecting a visual or quantitative test. section 2.6.1
